Tuberc Respir Dis > Volume 86(3); 2023 > Article
Kwon, Han, Lee, Kang, Kim, Kim, Park, Lee, Kim, Kim, and Yeo: Prediction of Postoperative Lung Function in Lung Cancer Patients Using Machine Learning Models

Abstract

Background

Surgical resection is the standard treatment for early-stage lung cancer. Since postoperative lung function is related to mortality, predicted postoperative lung function is used to determine the treatment modality. The aim of this study was to evaluate the predictive performance of linear regression and machine learning models.

Methods

We extracted data from the Clinical Data Warehouse and developed three sets: set I, the linear regression model; set II, machine learning models omitting the missing data: and set III, machine learning models imputing the missing data. Six machine learning models, the least absolute shrinkage and selection operator (LASSO), Ridge regression, ElasticNet, Random Forest, eXtreme gradient boosting (XGBoost), and the light gradient boosting machine (LightGBM) were implemented. The forced expiratory volume in 1 second measured 6 months after surgery was defined as the outcome. Five-fold cross-validation was performed for hyperparameter tuning of the machine learning models. The dataset was split into training and test datasets at a 70:30 ratio. Implementation was done after dataset splitting in set III. Predictive performance was evaluated by R2 and mean squared error (MSE) in the three sets.

Results

A total of 1,487 patients were included in sets I and III and 896 patients were included in set II. In set I, the R2 value was 0.27 and in set II, LightGBM was the best model with the highest R2 value of 0.5 and the lowest MSE of 154.95. In set III, LightGBM was the best model with the highest R2 value of 0.56 and the lowest MSE of 174.07.

Conclusion

The LightGBM model showed the best performance in predicting postoperative lung function.

Introduction

Lung cancer is the leading cause of cancer-related deaths worldwide and chronic obstructive pulmonary disease (COPD) is the most common comorbid disease in patients with lung cancer [1-3]. Since lung cancer risk increases with age, the incidence rates of lung cancer are higher in elderly people. The lung parenchymal structure changes with age, resulting in the loss of elastic recoil and senile hyperinflation [4]. These previous studies showed that patients with lung cancer tended to have decreased lung function.
Surgical resection is the standard treatment for early-stage lung cancer. Patients with higher perioperative risks such as COPD and older age are at higher risk for postoperative complications and mortality after resection [5]. The assessment of perioperative risk is essential because surgery is an invasive treatment, and it affects postoperative lung function [6,7]. Since postoperative lung function is related to the quality of life and mortality, treatment modalities are determined according to the predicted postoperative lung function. The predicted postoperative forced expiratory volume in 1 second (ppoFEV1) is widely used as a parameter to represent postoperative lung function [8,9]. Several methods are used to compute ppoFEV1, such as a formula based on the number of resected segments [10], quantitative computed tomography (CT), and perfusion scintigraphy [9].
In recent clinical practice, minimally invasive surgical procedures such as video-assisted thoracic surgery have become routine [11,12]. A previous study showed that the actual postoperative lung function differed from the ppoFEV1 depending upon the extent of the resection [13]. Patients with COPD experienced smaller decreases in FEV1 than in the ppoFEV1 [14]. These studies showed a discrepancy between the actual postoperative lung function and the ppoFEV1. Previous attempts have been made to predict postoperative lung function more accurately, but these were limited by the wide diversity of individual characteristics of the patients. Therefore, by predicting postoperative lung function for each individual more precisely, personalized cancer treatment can be made available.
Recently, machine learning methods have begun to be used in many different clinical settings for predicting outcomes [15]. Previous studies showed that machine learning could outperform conventional statistical models, such as logistic regression [16,17]. The objective of this study was to compare the conventional statistical model of linear regression with the machine learning model to predict postoperative pulmonary lung function in patients with lung cancer.

Materials and Methods

1. Study design and database

We retrospectively investigated the Clinical Data Warehouse (CDW) database from the Department of Medical Informatics at College of Medicine, The Catholic University of Korea. A total of 4,342 patients with lung cancer who underwent surgery with mediastinal lymph node dissection at seven hospitals in the Catholic University of Korea (Seoul St. Mary’s Hospital, Incheon St. Mary’s Hospital, Yeouido St. Mary’s Hospital, Eunpyeong St. Mary’s Hospital, Bucheon St. Mary’s Hospital, St. Vincent’s Hospital, and Uijeongbu St. Mary’s Hospital) from 1997 to 2019 were extracted from the database. Of them, 2,855 patients were excluded due to missing preoperative FEV1 values or 6-month postoperative FEV1 values, as shown in Figure 1. Finally, 1,487 patients were selected for analysis. Since there were many missing values in the post-bronchodilator pulmonary function test (PFT) values, we used pre-bronchodilator PFT values; predicted FEV1 and forced vital capacity (FVC) (%) throughout the study.

2. Variable selection and outcome definition

Demographic data including age, gender, body mass index, smoking history, type of surgery, histologic features, tumor stage according to the eighth tumor-node-metastasis (TNM) classification, cancer location, blood test results, comorbidities, usage of COPD medications, treatment modalities (neoadjuvant chemotherapy, adjuvant chemotherapy, palliative chemotherapy, neoadjuvant radiotherapy, adjuvant radiotherapy, and palliative therapy) and pre-bronchodilator PFT results were collected. The continuous variables are presented as the mean with standard deviation and the categorical variables are expressed as numbers with percentages. Regarding smoking history, patients were grouped into never smokers if they had smoked fewer than 100 cigarettes or never smoked in their lifetime, and as ever smokers if they had smoked at least 100 cigarettes in their lifetime. The types of surgery were grouped into three groups, the sublobar resection group if patients had received sublobar resection (segmentectomy, wedge resection, etc.), the lobectomy group if patients had received lobectomy, and the others group. PFT was performed in accordance with the American Thoracic Society/European Respiratory Society standardization guidelines. To measure the effect of COPD medications and determine whether the point of time when the COPD medications began to affect the outcome, the date when the patient started the medicine was considered to be a variable. V0 was defined as the time interval from 3 months before surgery to the surgery date and V1 was defined as 6±3 months after surgery. For example, roflumilast V1 indicated that the patients had taken roflumilast 6±3 months after surgery. The baseline PFT results, including FEV1, FVC, the FEV1/FVC ratio, diffusing capacity of the lung for carbon monoxide, the residual volume (RV)/total lung capacity (TLC) ratio, and laboratory results including complete blood count, albumin, C-reactive protein, lactate dehydrogenase (LDH), and creatinine levels were measured at V0. Comorbidities were considered if they were diagnosed 5 years before and after surgery. Recurrence was defined based on radiological or histologic evidence of cancer 6 months after surgery. The details of the variables are shown in Table 1. To represent postoperative lung function, predicted FEV1 (%) measured at V1 was defined as an outcome. The performance of the linear regression model and machine learning models in predicting the outcome was evaluated.

3. Statistical analyses

We developed three different sets for the linear regression and machine learning models according to the method used to handle missing data. In set I, simple linear regression was performed to evaluate the individual effects of the variables on predicting postoperative lung function. All variables with a p-value of less than 0.07 in the simple linear regression analysis were included in the multiple linear regression analysis. The imputation of missing data and splitting were not implemented in set I. The dataset was split into training and test datasets at a 70:30 ratio for the machine learning model. In set II, patients who did not have data for all of the selected variables were excluded, meaning that a patient with only one variable missing was excluded. In set III, we implemented missing value imputation rules using only the training dataset. Imputation was implemented with linear regression analysis of the continuous variables and logistic regression analysis of the categorical variables using the simpleimputer function in the Python package Autoimpute. These imputation rules were applied to the test dataset. A total of 1,487 patients were in sets I and III and 896 patients were in set II. Since scaling the data showed poorer performance than using the raw data, raw data were used in all sets. The study flow diagram is presented in Figure 1.
In sets II and III, we implemented six machine learning models, least absolute shrinkage and selection operator (LASSO), ridge regression, ElasticNet, Random Forest, eXtreme gradient boosting (XGBoost), and the light gradient boosting machine (LightGBM) to predict 6-month postoperative lung function in the developed dataset. Five-fold cross-validation was performed for hyperparameter tuning of the machine learning models. After hyperparameter optimization, we used the following parameters in each model.
Mean squared error (MSE) and R2 were used in the test dataset to assess the predictive quality of the models. Data analyses were performed using R version 4.0.2 (The R Foundation, Vienna, Austria) and Python 3.7 (Python Software Foundation, Wilmington, DE, USA). The specific Python package used was Autoimpute.

4. Ethics approval

This study was reviewed and approved by the Institutional Review Board (IRB) of the Eunpyeong St. Mary’s Hospital, College of Medicine, The Catholic University of Korea (IRB approval number: XC20WIDI0027P). Written informed consent by the patients was waived due to the retrospective nature of our study.

Results

1. Overall patient characteristics

A total of 1,487 patients with primary lung cancer who received surgery with mediastinal lymph node dissection and did not relapse for up to 6 months after surgery were included. The patient characteristics are presented in Table 1.

2. Linear regression model

The results of the single linear regression model are provided in Table 2. Variables with a p-value of less than 0.07 were entered into the multiple linear regression model as presented in Table 3. The male gender was negatively correlated with FEV1 V1 compared to the female gender, and regarding the type of surgery, lobectomy and other methods were negatively correlated compared to sublobar resection. LDH levels and inhaler V0 were negatively correlated and FVC V0 was positively correlated.

3. Predictive performance

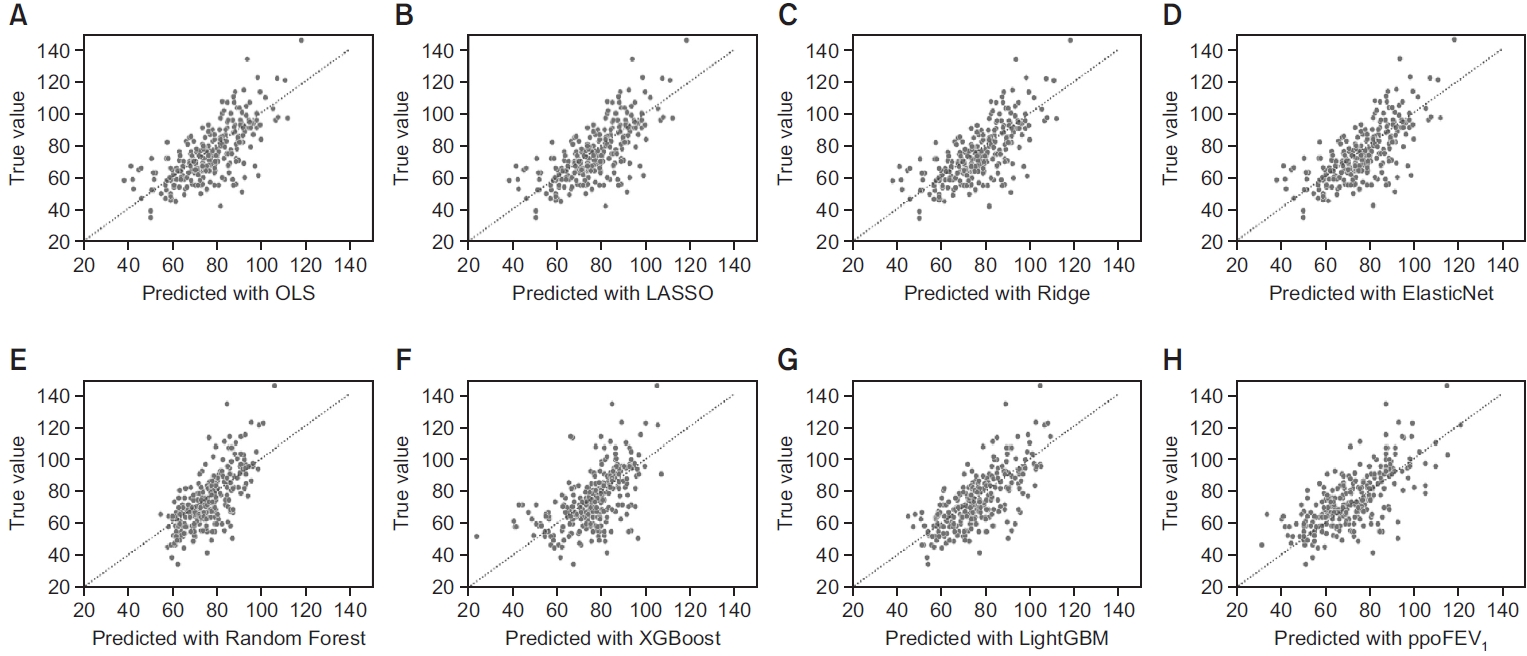
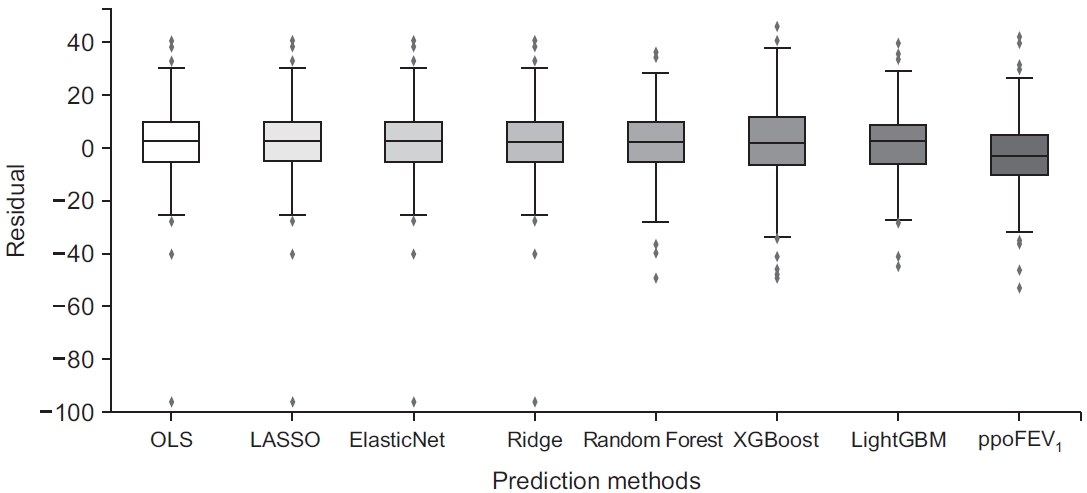
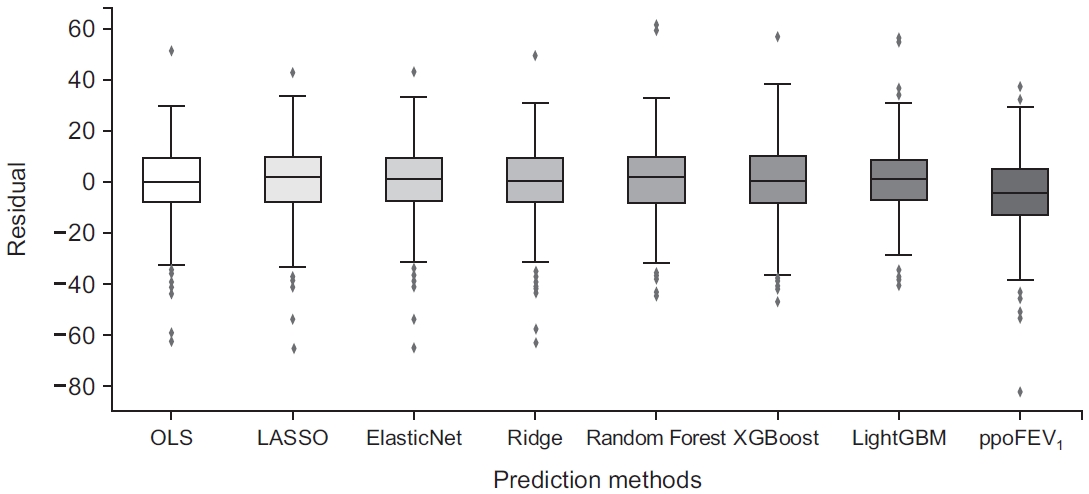
The scatter plots of actual postoperative FEV1 (%) and the predicted postoperative FEV1 (%) of prediction models in sets II and III are presented in Figures 2, 3. The residual box plots of prediction models in sets II and III are presented in Figures 4, 5. Residuals were calculated by the formula: residual=predicted postoperative FEV1 (%)-actual postoperative FEV1 (%). Linear regression coefficients were estimated by ordinary least squares regression. The range between the maximum residual and minimum residual and the box was narrowest in the LightGBM model in both sets. The predictive performance evaluated by MSE and R2 for each classifier in sets II and III was computed based on the test dataset and is described in Table 4. In set I, the R2 value was 0.27 with p<0.001. In set II, the best classifier for predicting 6-month postoperative lung function was LightGBM with an MSE of 154.95 and an R2 value of 0.5. In set III, the best classifier was LightGBM with an MSE of 174.07 and an R2 value of 0.56. Since LightGBM in set III (imputing missing data) had the highest explanatory power with the highest R2 value of 0.56 and the lowest MSE, it was the best model for predicting 6-month postoperative lung function.

4. Importance scores

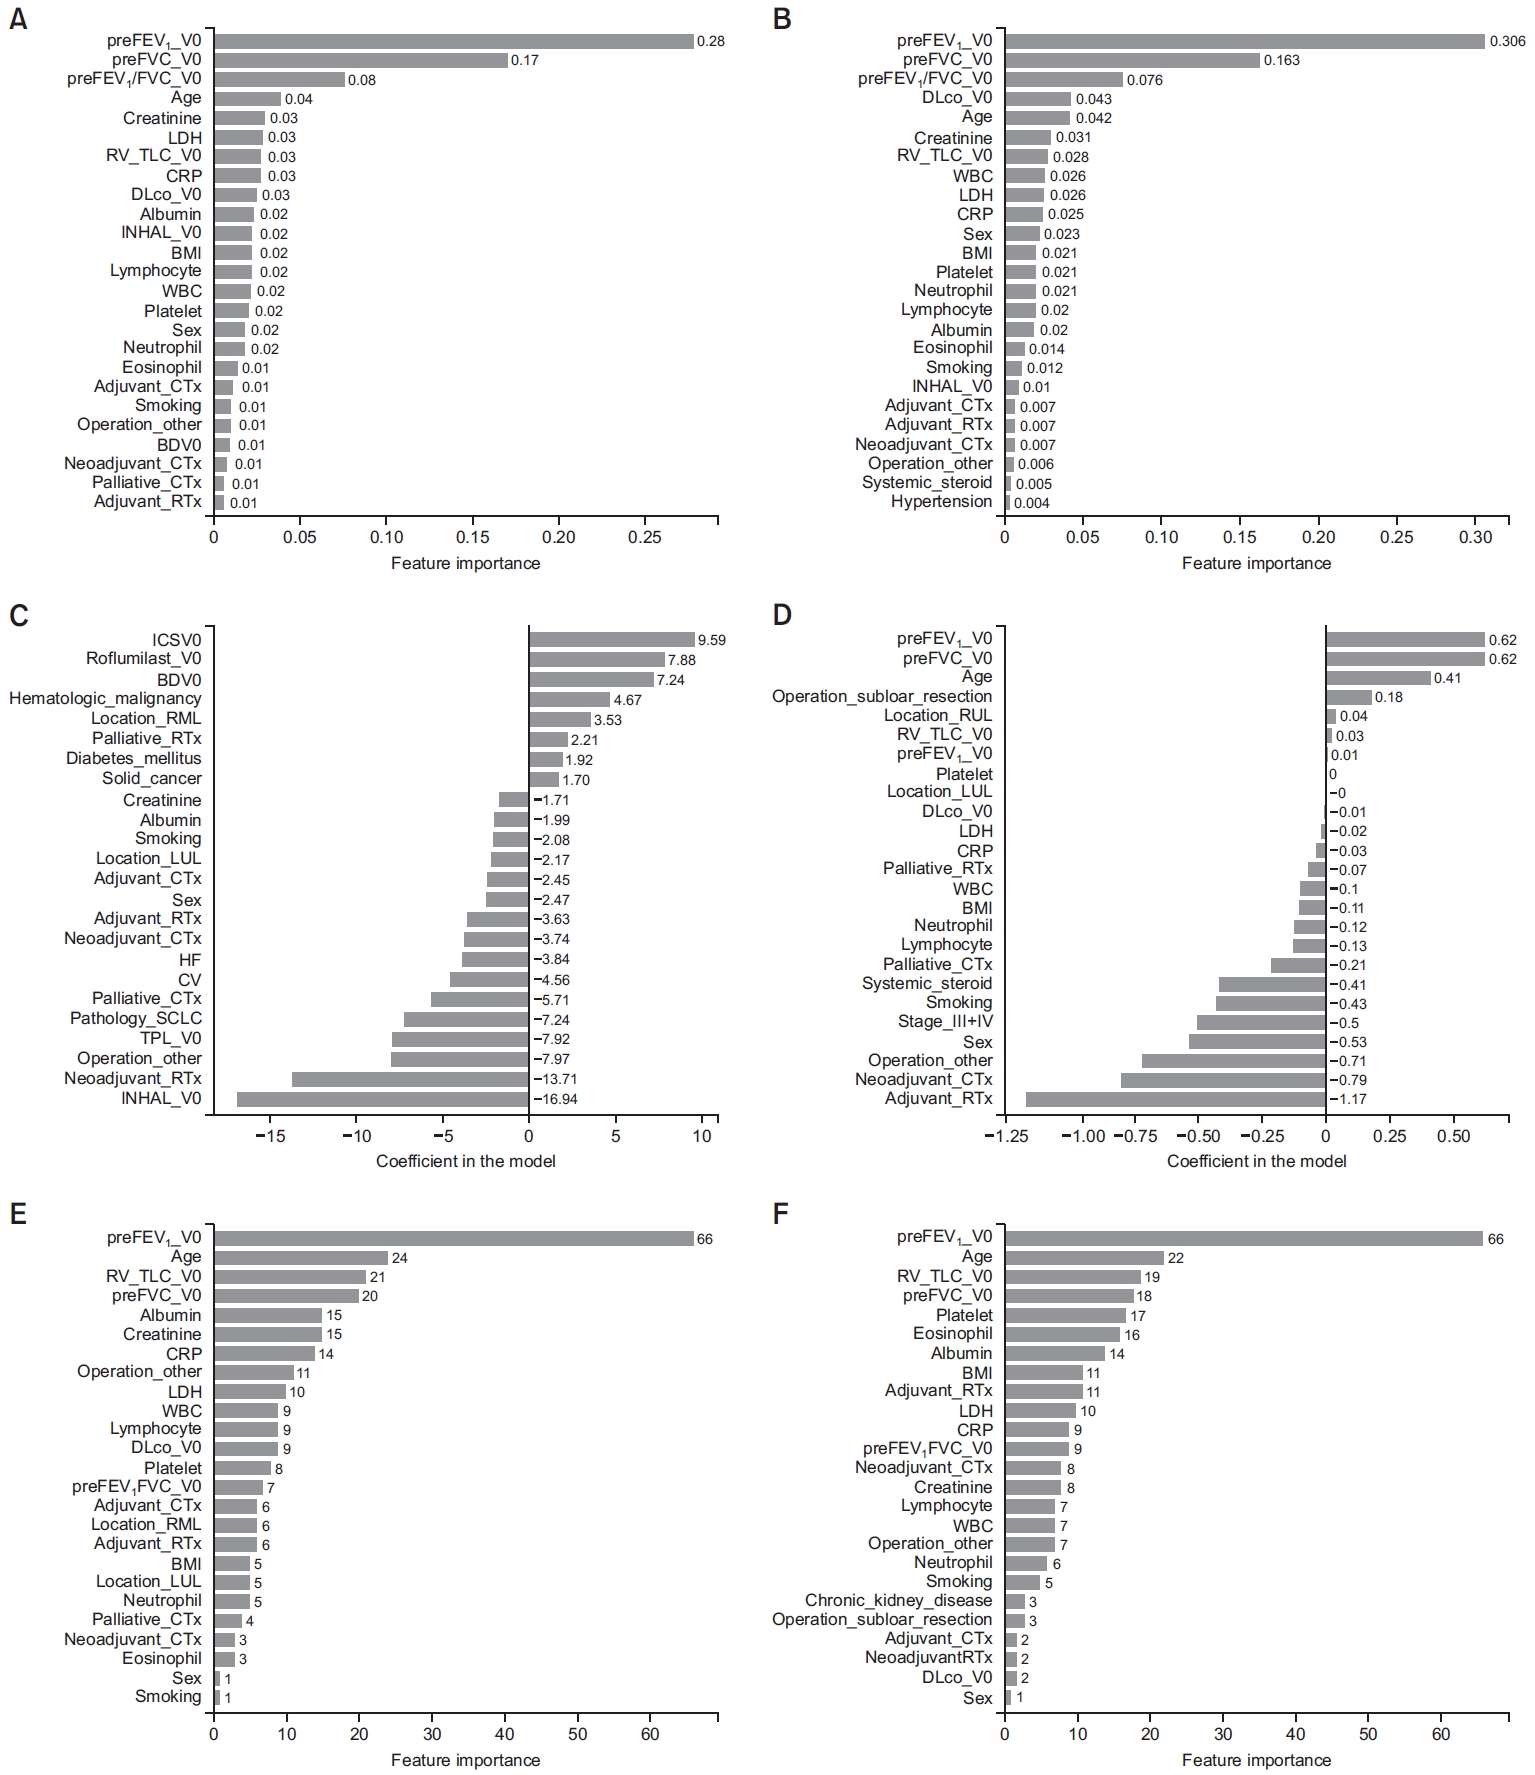
The importance scores (β coefficients) for the variables in Random Forest, XGBoost, and LightGBM are presented in Figure 6. In Figure 6A, C, E missing data were omitted and in Figure 6B, D, F missing data were imputed. The variable with the highest importance score was preFEV1 V0 in the Random Forest model and the LightGBM model. In the Random Forest model with set III, preFVC V0 was the variable with the second-highest importance score (0.163). In the XGBoost model, inhaler V0 had the largest absolute value of the coefficient in set II and adjuvant radiotherapy had the largest value in set III. In LightGBM, age was the second-highest variable and RV/TLC V0 was the third-highest variable.

Discussion

In this study, we found that machine learning models outperformed the traditional linear model and the previous prediction method using the number of resected lung segments in predicting postoperative lung function. Moreover, in all machine learning models, imputing the missing data showed performance superior to omitting the missing data, as presented in Table 4. Overall, the LightGBM model had the highest explanatory power with an R2 value of 0.561 and the lowest MSE of 174.07. It outperformed the previous method of predicting postoperative lung function using the number of lung segments resected in set III which had R2 value of 0.368 and MSE of 250.06 as shown in Table 4. Moreover, as presented in Figure 5, the previous method had large negative residuals and a relatively longer whiskers than the LightGBM model. Since the linear regression model showed a relatively low R2 at only 0.27, the results of this study might suggest that machine learning models could improve predictive accuracy given the same data.
In multiple linear regression analysis, the variables with statistical significance were sex, type of surgery, LDH level, inhaler V0, and FVC V0, as presented in Table 3. In regard to the type of surgery, as the range of surgery types increased, the postoperative lung function decreased. Compared to sublobar resection, lobectomy had a parameter estimate of -6.44. This was consistent with previous studies that showed limited resection such as sublobar resection preserved postoperative lung function [18,19]. In another previous study, the ppoFEV1 was calculated using the formula: ppoFEV1=preFEV1×[1-(S×0.0526)]; where S is the number of segments resected [13]. This formula correlated well when patients underwent lobectomy. However, in patients who underwent pneumonectomy, the actual postoperative FEV1 was an average of 250 mL higher than ppoFEV1. This indicates that an adjustment factor is required to increase the accuracy of predicting postoperative lung function. To achieve this, we considered a variety of factors as independent variables to serve as an adjustment factor and pre-bronchodilator postoperative FEV1 V1 as a dependent variable.
In the machine learning models, the variables with the highest importance scores varied in each model. In the ridge regression model, preFVC V0 was the highest variable followed by preFEV1 V0 and age variables. In the LightGBM model, preFEV1V0 was the highest variable followed by age and RV/TLC V0. In the XGBoost model of set III, adjuvant radiotherapy was the highest variable followed by neoadjuvant chemotherapy. Since COPD and lung cancer are known to be linked diseases [20], COPD is highly prevalent in patients with lung cancer. COPD has a characteristic of hyperinflated lungs, resulting in an increase in the RV/TLC ratio. The all-cause mortality was higher in COPD patients who had higher RV/TLC values [21]. Because surgery reduces this hyperinflation, patients who underwent surgery exhibited better preservation of FEV1 [22]. In our previous study, lung cancer patients with COPD had higher RV/TLC values than lung cancer patients without COPD. Lung cancer patients with COPD had preserved postoperative lung functions compared to patients without COPD. Therefore, the RV/TLC value was positively correlated with postoperative lung function [23]. We found that the RV/TLC value was also influential in predicting postoperative lung function with machine learning models.
When handling the missing data, we compared the predictive performance of each model in two methods, one in which the missing data were omitted, and another in which the missing data with imputed by implementing linear regression analysis for the continuous variables and logistic regression for the categorical variables. As shown in Table 4, by implementing the missing data, the R2 value increased in all models. In data analysis, handling missing data is important and deleting missing values causes a massive loss of information, leading to a decrease in statistical power [24-26]. Therefore, the imputation of missing data should be implemented when handling big data.
This study had several limitations. The CDW had a relatively large number of incomplete data and this might lead to selection bias. Patients who did not have postoperative FEV1 data were excluded. Physicians usually measure FEV1 when patients experience symptoms such as shortness of breath. Therefore, patients without postoperative FEV1 data might have had relatively preserved FEV1. Imaging studies like CT are also known as factors predicting postoperative lung function but these data were not available. The inclusion of laboratory data and other variables might have been irrelevant, and these data might have impaired the explanatory power. Future studies are required to enhance the explanatory power by increasing the sample size, including appropriate variables, and excluding irrelevant variables.
In predicting postoperative lung function for lung cancer patients, machine learning models performed modestly better than the linear regression model. The highest explanatory power was achieved by the LightGBM model by imputing the missing data. The preoperative FEV1 and RV/TLC values had a large impact on postoperative lung function. These findings suggest that machine learning models can be used as a predictive tool. Future studies are needed to improve the predictive performance.

Notes

Authors’ Contributions

Conceptualization: Yeo CD. Methodology: Kwon OB, Han S, Lee HY, Lee SH. Formal analysis: Kim SK, Park CK, Kim JW. Data curation: Kang HS, Kim JS, Kim SJ. Software: Han S. Validation: Han J. Writing - original draft preparation: Kwon OB. Writing - review and editing: Han S, Yeo CD. Approval of final manuscript: all authors.

Conflicts of Interest

No potential conflict of interest relevant to this article was reported.

Funding

This study was supported by a 2020 grant from The Korean Academy of Tuberculosis and Respiratory Diseases.

Fig. 1.
Flow chart. Six machine learning models were implemented in sets II and III, least absolute shrinkage and selection operator (LASSO), Ridge regression, ElasticNet, Random Forest, eXtreme gradient boosting (XGBoost), and light gradient boosting machine (LightGBM). Missing data were omitted in set II and implemented in set III. The training dataset and test dataset were split at a 70:30 ratio. Implementation was done after data splitting in set III. FEV1: forced expiratory volume in 1 second.
trd-2022-0048f1.jpg
Fig. 2.
Scatter plot of the actual postoperative forced expiratory volume in 1 second (FEV1, %) and predicted FEV1 (%) pairwise of the models in set II. (A) Ordinary least squares (OLS), (B) least absolute shrinkage and selection operator (LASSO), (C) Ridge regression, (D) ElasticNet, (E) Random Forest, (F) eXtreme gradient boosting (XGBoost), (G) light gradient boosting machine (LightGBM), and (H) predicted postoperative forced expiratory volume in 1 second (ppoFEV1)=preFEV1×[1-(number of segments×0.0526)].
trd-2022-0048f2.jpg
Fig. 3.
Scatter plot of the actual postoperative forced expiratory volume in 1 second (FEV1) and predicted FEV1 pairwise of the models in set III. (A) Ordinary least squares (OLS), (B) least absolute shrinkage and selection operator (LASSO), (C) Ridge regression, (D) ElasticNet, (E) Random Forest, (F) eXtreme gradient boosting (XGBoost), (G) light gradient boosting machine (LightGBM), and (H) predicted postoperative forced expiratory volume in 1 second (ppoFEV1)=preFEV1×[1-(number of segments×0.0526)].
trd-2022-0048f3.jpg
Fig. 4.
Residual boxplot of each prediction method in set II. Residual: predicted forced expiratory volume in 1 second (FEV1)-actual postoperative FEV1; OLS: ordinary least squares; LASSO: least absolute shrinkage and selection operator; XGBoost: eXtreme gradient boosting; LightGBM: light gradient boosting machine; ppoFEV1: predicted postoperative forced expiratory volume in 1 second: ppoFEV1=preFEV1×[1-(number of segments×0.0526)].
trd-2022-0048f4.jpg
Fig. 5.
Residual boxplot of each prediction method in set III. Residual: predicted forced expiratory volume in 1 second (FEV1)-actual postoperative FEV1; OLS: ordinary least squares; LASSO: least absolute shrinkage and selection operator; XGBoost: eXtreme gradient boosting; LightGBM: light gradient boosting machine; ppoFEV1: predicted postoperative forced expiratory volume in 1 second: ppoFEV1=preFEV1×[1-(number of segments×0.0526)].
trd-2022-0048f5.jpg
Fig. 6.
Mean squared error (MSE) and R2 of the machine learning models. (A, B) Set II, III Random Forest, (C, D) set II, III eXtreme gradient boosting (XGBoost), (E, F) set II, III light gradient boosting machine (LightGBM). FEV1: forced expiratory volume in 1 second; V0: time interval from 3 months before surgery to the surgery date; FVC: forced vital capacity; LDH: lactate dehydrogenase; RV: residual volume; TLC: total capacity; CRP: C-reactive protein; DLCO: diffusing capacity of the lung for carbon monoxide; BMI: body mass index; CTx: chemotherapy; BD: bronchodilator; RTx: radiotherapy; WBC: white blood cell; ICS: inhaled corticosteroid; RML: right middle lobe; LUL: left upper lobe; HF: heart failure; CV: cardiovascular disease; SCLC: small cell lung cancer; TPL: theophylline; RUL: right upper lobe.
trd-2022-0048f6.jpg
Table 1.
Demographics of patients with primary lung cancer who received surgery with mediastinal lymph node dissection and did not relapse for up to 6 months after surgery (1997-2019)
Variable Value
Sex 1,487
 Female 491 (33.0)
 Male 996 (67.0)
Age 1,487
 Mean±SD, yr 66.8±9.1
BMI 1,485
 Mean±SD, kg/m2 24.3±5.7
Smoking 1,415
 Never 903 (63.8)
 Ever 512 (36.2)
Operation 1,487
 Limited resection 152 (10.2)
 Lobectomy 1,200 (80.7)
 Others 135 (9.1)
Staging 1,483
 1 914 (61.6)
 2 292 (19.7)
 3 271 (18.3)
 4 6 (0.4)
Pathology 1,484
 SCLC 26 (1.8)
 NSCLC 1,458 (98.2)
Pathology type 1,484
 Adenocarcinoma 959 (64.6)
 Squamous cell carcinoma 423 (28.5)
 Adenosquamous carcinoma 21 (1.4)
 LCC, LCNEC 25 (1.7)
 SCLC 26 (1.8)
 Others 30 (2.0)
Location 1,485
 RUL 469 (31.6)
 RML 92 (6.2)
 RLL 328 (22.1)
 LUL 340 (22.9)
 LLL 256 (17.2)
Hypertension 1,493
 No 977 (65.7)
 Yes 510 (34.3)
Diabetes 1,487
 No 1,040 (69.9)
 Yes 447 (30.1)
Heart failure 1,487
 No 1,393 (93.7)
 Yes 94 (6.3)
IHD 1,487
 No 1,239 (83.3)
 Yes 248 (16.7)
Cerebral infarction 1,487
 No 1,468 (98.7)
 Yes 19 (1.3)
CKD 1,487
 No 1,431 (96.2)
 Yes 56 (3.8)
Solid cancer 1,487
 No 1,351 (90.9)
 Yes 136 (9.1)
Hematologic cancer 1,487
 No 1,468 (84.5)
 Yes 246 (16.5)
WBC 1,487
 Mean±SD, 103/μL 14.7±5.3
Eosinophil 1,487
 Mean±SD, % 0.5±1.2
Neutrophil 1,486
 Mean±SD, % 82.6±9.3
Lymphocyte 1,486
 Mean±SD, % 11.3±7.7
Platelet 1,487
 Mean±SD, 103/μL 228.8±71.8
Albumin 1,415
 Mean±SD, g/dL 3.6±0.5
CRP 1,396
 Mean±SD, mg/dL 2.4±8.8
LDH 1,155
 Mean±SD, U/L 384.2±138.1
Creatinine 1,485
 Mean±SD, mg/dL 0.80±0.39
Inhaler V0 1,487
 No 1,241 (83.5)
 Yes 246 (16.5)
BD V0 1,487
 No 1,311 (88.2)
 Yes 176 (11.8)
ICS V0 1,487
 No 1,417 (95.3)
 Yes 70 (4.7)
Doxofylline V0 1,487
 No 1,408 (94.7)
 Yes 79 (5.3)
Roflumilast V0 1,487
 No 1,486 (99.9)
 Yes 1 (0.1)
Theophylline V0 1,487
 No 1,475 (99.2)
 Yes 12 (0.8)
Steroid V0 1,487
 No 1,155 (77.7)
 Yes 332 (22.3)
Inhaler V1 1,487
 No 1,075 (72.3)
 Yes 412 (27.7)
BD V1 1,487
 No 1,224 (82.3)
 Yes 263 (17.7)
ICS V1 1,487
 No 1,338 (90.0)
 Yes 149 (10.0)
Doxofylline V1 1,487
 No 1,080 (72.6)
 Yes 407 (27.4)
Roflumilast V1 1,487
 No 1,485 (99.9)
 Yes 2 (0.1)
Theophylline V1 1,487
 No 1,458 (98.1)
 Yes 29 (1.9)
Steroid V1 1,487
 No 393 (26.4)
 Yes 1,094 (73.6)
Neoadjuvant chemotherapy 1,487
 No 1,335 (89.8)
 Yes 152 (10.2)
Adjuvant chemotherapy 1,487
 No 970 (65.2)
 Yes 517 (34.8)
Palliative chemotherapy 1,487
 No 1,306 (87.8)
 Yes 181 (12.2)
Neoadjuvant radiotherapy 1,487
 No 1,453 (97.7)
 Yes 34 (2.3)
Adjuvant radiotherapy 1,487
 No 1,218 (81.9)
 Yes 269 (18.1)
Palliative radiotherapy 1,487
 No 1,277 (85.9)
 Yes 210 (14.1)
FVC V0 1,478
 Mean±SD, % 93.3±25.4
FEV1 V0 1,476
 Mean±SD, % 98.8±209.0
FEV1/FVC V0 1,476
 Mean±SD, % 71.2±10.1
DLCO V0 1,402
 Mean±SD, % 86.9±26.3
RV/TLC V0 1,357
 Mean±SD, % 38.3±16.9
DFS event 1,487
 No 974 (65.5)
 Yes 513 (34.5)
DFS duration 1,487
 Mean±SD, day 1,026.1±843.2
OS event 1,487
 No 1,185 (79.7)
 Yes 302 (20.3)
OS duration 1,487
 Mean±SD, day 1,187.2±949.9

Values are presented as frequency (%) or mean±standard deviation.

SD: standard deviation; BMI: body mass index; SCLC: small cell lung cancer; NSCLC: non-small cell lung cancer; LCC: large cell carcinoma; LCNEC: large cell neuroendocrine carcinoma; RUL: right upper lobe; RML: right middle lobe; RLL: right lower lobe; LUL: left upper lobe; LLL: left lower lobe; IHD: ischemic heart disease; CKD: chronic kidney disease; WBC: white blood cell; CRP: C-reactive protein; LDH: lactate dehydrogenase; V0: time interval from 3 months before surgery to the surgery date; BD: bronchodilator; ICS: inhaled corticosteroid; V1: time interval from 3 to 9 months after the surgery date; FVC: forced vital capacity; FEV1: forced expiratory volume in 1 second; DLCO: diffusing capacity of the lung for carbon monoxide; RV: residual volume; TLC: total capacity; DFS: disease-free survival; OS: overall survival.

Table 2.
Simple linear regression results
Variable β±SE p-value
Sex
 Female Reference
 Male -11.16±1.04 <0.001
Age, yr 0.29±0.06 <0.001
BMI, kg/m2 -0.11±0.09 0.211
Smoking
 Never Reference
 Ever -7.83±1.06 <0.001
Operation
 Limited resection Reference
 Lobectomy -9.33±1.61 <0.001
 Others -4.98±1.03 <0.001
Staging
 1, 2 Reference
 3, 4 -4.03±1.03 0.002
Pathology
 SCLC Reference
 NSCLC 7.04±3.87 0.002
Location
 RML Reference
 RUL -3.43±2.23 0.123
 RLL -5.05±2.30 0.029
 LUL -5.20±2.30 0.024
 LLL -3.27±2.37 0.169
Labortary results
 WBC, 103/μL -0.11±0.10 0.251
 Eosinphil, % -0.60±0.41 0.148
 Neutrophil, % 0.03±0.05 0.624
 Lymphocyte, % 0.08±0.07 0.199
 Platelet, 103/μL -0.01±0.01 0.124
 Albumin, g/dL 5.23±1.13 <0.001
 CRP, mg/dL -0.11±0.06 0.066
 LDH, U/L -0.02±0.00 <0.001
 Creatinine, mg/dL -6.19±1.30 <0.001
Comorbidites
 Hypertension -2.19±1.07 0.04
 Diabetes -3.28±1.10 0.003
 Heart failure -8.64±2.07 <0.001
 Ischemic heart disease -2.05±1.36 0.132
 Cerebral infarction 1.85±4.51 0.683
 Chronic kidney disease 0.20±2.66 0.940
 Solid cancer 1.47±1.76 0.403
 Hematologic cancer 5.74±4.51 0.204
COPD treatments
 Inhaler V0 -10.15±1.34 <0.001
 BD V0 -7.18±1.56 <0.001
 ICS V0 -14.53±2.36 <0.001
 Doxofylline V0 -9.40±2.25 <0.001
 Roflumilast V0 -24.04±19.55 0.219
 Theophylline V0 -16.74±5.65 0.003
Cancer treatments
 Neoadjuvant chemotherapy -12.18±3.38 <0.001
 Adjuvant chemotherapy -5.22±1.06 <0.001
 Neoadjuvant radiotherapy -12.81±3.38 <0.001
 Adjuvant radiotherapy -7.04±1.30 <0.001
PFT
 preFVC V0, % 0.26±0.02 <0.001
 preFEV1 V0, % 0.01±0.00 0.002
 preFEV1/FVC V0, % 0.71±0.05 <0.001
 DLC0 V0, % 0.12±0.02 <0.001
 RV/TLC V0, % -0.05±0.03 0.139

β: point estimation; SE: standard error; BMI: body mass index; SCLC: small cell lung cancer; NSCLC: non-small cell lung cancer; RUL: right upper lobe; RML: right middle lobe; RLL: right lower lobe; LUL: left upper lobe; LLL: left lower lobe; WBC: white blood cell; CRP: C-reactive protein; LDH: lactate dehydrogenase; COPD: chronic obstructive pulmonary disease; V0: time interval from 3 months before surgery to the surgery date; BD: bronchodilator; ICS: inhaled corticosteroid; PFT: pulmonary function test; FVC: forced vital capacity; FEV1: forced expiratory volume in 1 second; DLCO: diffusing capacity of the lung for carbon monoxide; RV: residual volume; TLC: total capacity.

Table 3.
Multiple linear regression, R2=0.27 for the model, p<0.001
Variable β±SE p-value Normalized GVIF
Intercept 51.30±4.95 <0.001
Age, yr 0.30±0.06 <0.001 1.030
Sex 1.032
 Female Reference
 Male -9.21±1.08 <0.001
Operation 1.030
 Sublobar resection Reference
 Lobectomy -6.44±1.63 <0.001
 Other -4.11±1.03 <0.001
Location 1.010
 RML Reference
 RUL -2.85± 2.16 0.187
 RLL -3.97±2.21 0.073
 LUL -5.97±2.23 0.008
 LLL -2.51±2.32 0.279
LDH, U/L -0.02±0.00 <0.001 1.032
Heart failure -5.22±2.03 0.010 1.018
Inhaler V0 -5.16±1.33 <0.001 1.015
Theophylline V0 -16.71±5.43 0.002 1.005
FVC V0, % 0.17±0.02 <0.001 1.015
FEV1 V0, % 0.00±0.00 0.016 1.004
DLCO V0, % 0.06±0.02 0.001 1.029

GVIF: generalized variation inflation factor; RML: right middle lobe; RUL: right upper lobe; RLL: right lower lobe; LUL: left upper lobe; LLL: left lower lobe; LDH: lactate dehydrogenase; V0: time interval from 3 months before surgery to the surgery date; FVC: forced vital capacity; FEV1: forced expiratory volume in 1 second; DLCO: diffusing capacity of the lung for carbon monoxide.

Table 4.
MSE and R2 values of the linear regression model, machine learning models, and ppoFEV1
Datasets Evaluation OLS LASSO Ridge regression ElasticNet Random Forest XGBoost LighGBM ppoFEV1
Set II MSE 212.94 196.44 192.47 196.44 158.44 203.18 154.95 195.11
R2 0.313 0.366 0.366 0.366 0.489 0.345 0.508 0.371
Set III MSE 227.77 193.48 186.29 191.56 192.2 198.17 174.07 250.06
R2 0.424 0.511 0.529 0.516 0.514 0.499 0.561 0.368

MSE: mean squared error; ppoFEV1: predicted postoperative forced expiratory volume in 1 second (%) calculated by the formula: ppoFEV1=preFEV1×[1-(number of segments×0.0526)]; OLS: ordinary least squares; LASSO: least absolute shrinkage and selection operator; XGBoost: extreme gradient boosting; LightGBM: light gradient boosting machine; Set II: omitting missing datasets; Set III: imputing missing datasets.

REFERENCES

1. Global Burden of Disease Cancer Collaboration, Fitzmaurice C, Dicker D, Pain A, Hamavid H, Moradi-Lakeh M, et al. The global burden of cancer 2013. JAMA Oncol 2015;1:505-27.
pmid pmc
2. Young RP, Hopkins RJ, Christmas T, Black PN, Metcalf P, Gamble GD. COPD prevalence is increased in lung cancer, independent of age, sex and smoking history. Eur Respir J 2009;34:380-6.
crossref pmid
3. Barta JA, Powell CA, Wisnivesky JP. Global epidemiology of lung cancer. Ann Glob Health 2019;85:8.
crossref pmid pmc
4. Venuta F, Diso D, Onorati I, Anile M, Mantovani S, Rendina EA. Lung cancer in elderly patients. J Thorac Dis 2016;8(Suppl 11):S908-14.
crossref pmid pmc
5. Donington J, Ferguson M, Mazzone P, Handy J Jr, Schuchert M, Fernando H, et al. American College of Chest Physicians and Society of Thoracic Surgeons consensus statement for evaluation and management for high-risk patients with stage I non-small cell lung cancer. Chest 2012;142:1620-35.
crossref pmid
6. Oswald NK, Halle-Smith J, Mehdi R, Nightingale P, Naidu B, Turner AM. Predicting postoperative lung function following lung cancer resection: a systematic review and meta-analysis. EClinicalMedicine 2019;15:7-13.
crossref pmid pmc
7. Lim E, Baldwin D, Beckles M, Duffy J, Entwisle J, FaivreFinn C, et al. Guidelines on the radical management of patients with lung cancer. Thorax 2010;65 Suppl 3:iii1-27.
crossref pmid
8. Wyser C, Stulz P, Soler M, Tamm M, Muller-Brand J, Habicht J, et al. Prospective evaluation of an algorithm for the functional assessment of lung resection candidates. Am J Respir Crit Care Med 1999;159(5 Pt 1):1450-6.
crossref pmid
9. Wu MT, Pan HB, Chiang AA, Hsu HK, Chang HC, Peng NJ, et al. Prediction of postoperative lung function in patients with lung cancer: comparison of quantitative CT with perfusion scintigraphy. AJR Am J Roentgenol 2002;178:667-72.
pmid
10. Cukic V. Preoperative prediction of lung function in pneumonectomy by spirometry and lung perfusion scintigraphy. Acta Inform Med 2012;20:221-5.
crossref pmid pmc
11. Batihan G, Ceylan KC, Usluer O, Kaya SO. Video-assisted thoracoscopic surgery vs thoracotomy for non-small cell lung cancer greater than 5 cm: is VATS a feasible approach for large tumors? J Cardiothorac Surg 2020;15:261.
crossref pmid pmc pdf
12. Landreneau RJ, Hazelrigg SR, Ferson PF, Johnson JA, Nawarawong W, Boley TM, et al. Thoracoscopic resection of 85 pulmonary lesions. Ann Thorac Surg 1992;54:415-20.
crossref pmid
13. Zeiher BG, Gross TJ, Kern JA, Lanza LA, Peterson MW. Predicting postoperative pulmonary function in patients undergoing lung resection. Chest 1995;108:68-72.
crossref pmid
14. Kushibe K, Kawaguchi T, Kimura M, Takahama M, Tojo T, Taniguchi S. Exercise capacity after lobectomy in patients with chronic obstructive pulmonary disease. Interact Cardiovasc Thorac Surg 2008;7:398-401.
crossref pmid
15. Chen JH, Asch SM. Machine learning and prediction in medicine: beyond the peak of inflated expectations. N Engl J Med 2017;376:2507-9.
crossref pmid pmc
16. Harford S, Darabi H, Del Rios M, Majumdar S, Karim F, Vanden Hoek T, et al. A machine learning based model for Out of Hospital cardiac arrest outcome classification and sensitivity analysis. Resuscitation 2019;138:134-40.
crossref pmid
17. Hirano Y, Kondo Y, Sueyoshi K, Okamoto K, Tanaka H. Early outcome prediction for out-of-hospital cardiac arrest with initial shockable rhythm using machine learning models. Resuscitation 2021;158:49-56.
crossref pmid
18. Toste PA, Lee JM. Limited resection versus lobectomy in early-stage non-small cell lung cancer. J Thorac Dis 2016;8:E1511-3.
crossref pmid pmc
19. Kodama K, Doi O, Higashiyama M, Yokouchi H. Intentional limited resection for selected patients with T1 N0 M0 non-small-cell lung cancer: a single-institution study. J Thorac Cardiovasc Surg 1997;114:347-53.
crossref pmid
20. Durham AL, Adcock IM. The relationship between COPD and lung cancer. Lung Cancer 2015;90:121-7.
crossref pmid pmc
21. Shin TR, Oh YM, Park JH, Lee KS, Oh S, Kang DR, et al. The prognostic value of residual volume/total lung capacity in patients with chronic obstructive pulmonary disease. J Korean Med Sci 2015;30:1459-65.
crossref pmid pmc pdf
22. Matsumoto R, Takamori S, Yokoyama S, Hashiguchi T, Murakami D, Yoshiyama K, et al. Lung function in the late postoperative phase and influencing factors in patients undergoing pulmonary lobectomy. J Thorac Dis 2018;10:2916-23.
crossref pmid pmc
23. Kwon OB, Yeo CD, Lee HY, Kang HS, Kim SK, Kim JS, et al. The value of residual volume/total lung capacity as an indicator for predicting postoperative lung function in nonsmall lung cancer. J Clin Med 2021;10:4159.
crossref pmid pmc
24. Kwak SK, Kim JH. Statistical data preparation: management of missing values and outliers. Korean J Anesthesiol 2017;70:407-11.
crossref pmid pmc pdf
25. Khan SI, Hoque AS. SICE: an improved missing data imputation technique. J Big Data 2020;7:37.
crossref pmid pmc pdf
26. Zhang Z. Missing values in big data research: some basic skills. Ann Transl Med 2015;3:323.
pmid pmc


ABOUT
ARTICLE & TOPICS
Article category

Browse all articles >

Topics

Browse all articles >

BROWSE ARTICLES
FOR CONTRIBUTORS
Editorial Office
101-605, 58, Banpo-daero, Seocho-gu (Seocho-dong, Seocho Art-Xi), Seoul 06652, Korea
Tel: +82-2-575-3825, +82-2-576-5347    Fax: +82-2-572-6683    E-mail: katrdsubmit@lungkorea.org                

Copyright © 2024 by The Korean Academy of Tuberculosis and Respiratory Diseases. All rights reserved.

Developed in M2PI

Close layer
prev next