 |
 |
| Tuberc Respir Dis > Volume 85(2); 2022 > Article |
|
Abstract
Background
Methods
Results
Notes
Authors’ Contributions
Conceptualization: Bade G, Talwar A, Madan K. Formal analysis: Shanmugasundaram K. Data curation: Shanmugasundaram K. Writing - original draft preparation: Shanmugasundaram K. Writing - review and editing: Shanmugasundaram K, Talwar A, Madan K, Bade G. Approval of final manuscript: all authors.
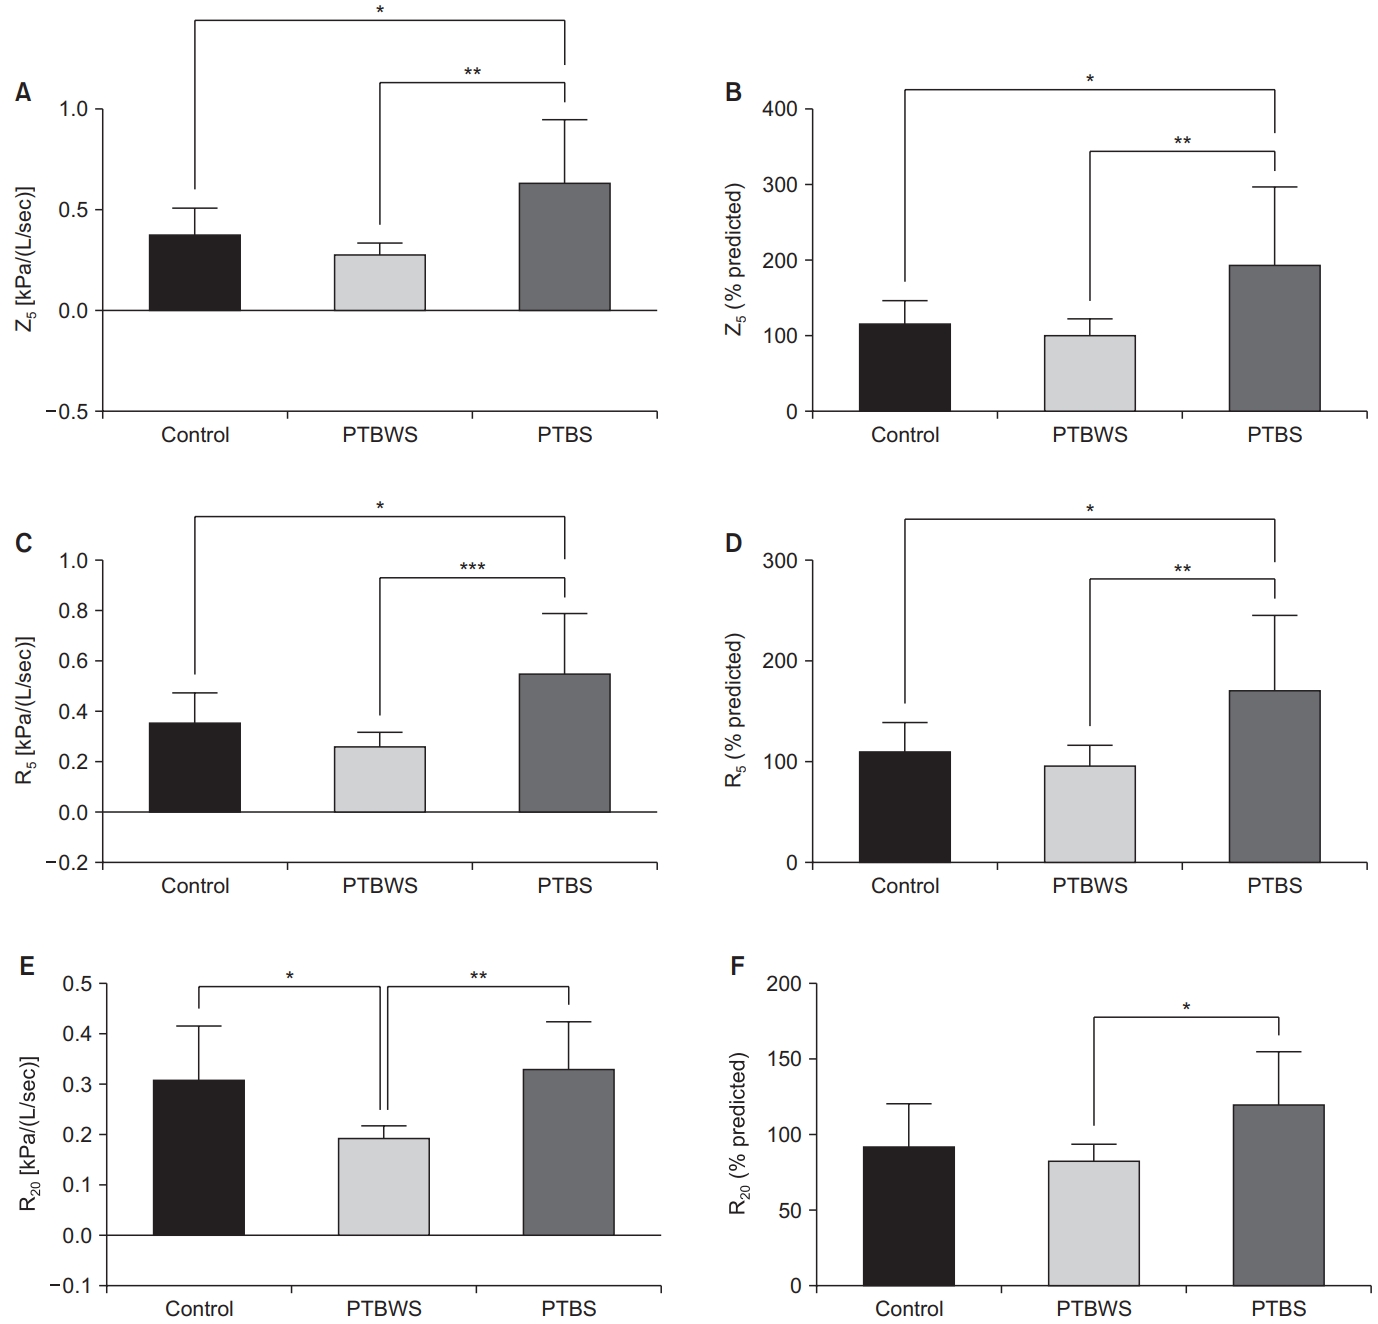
Fig. 1.

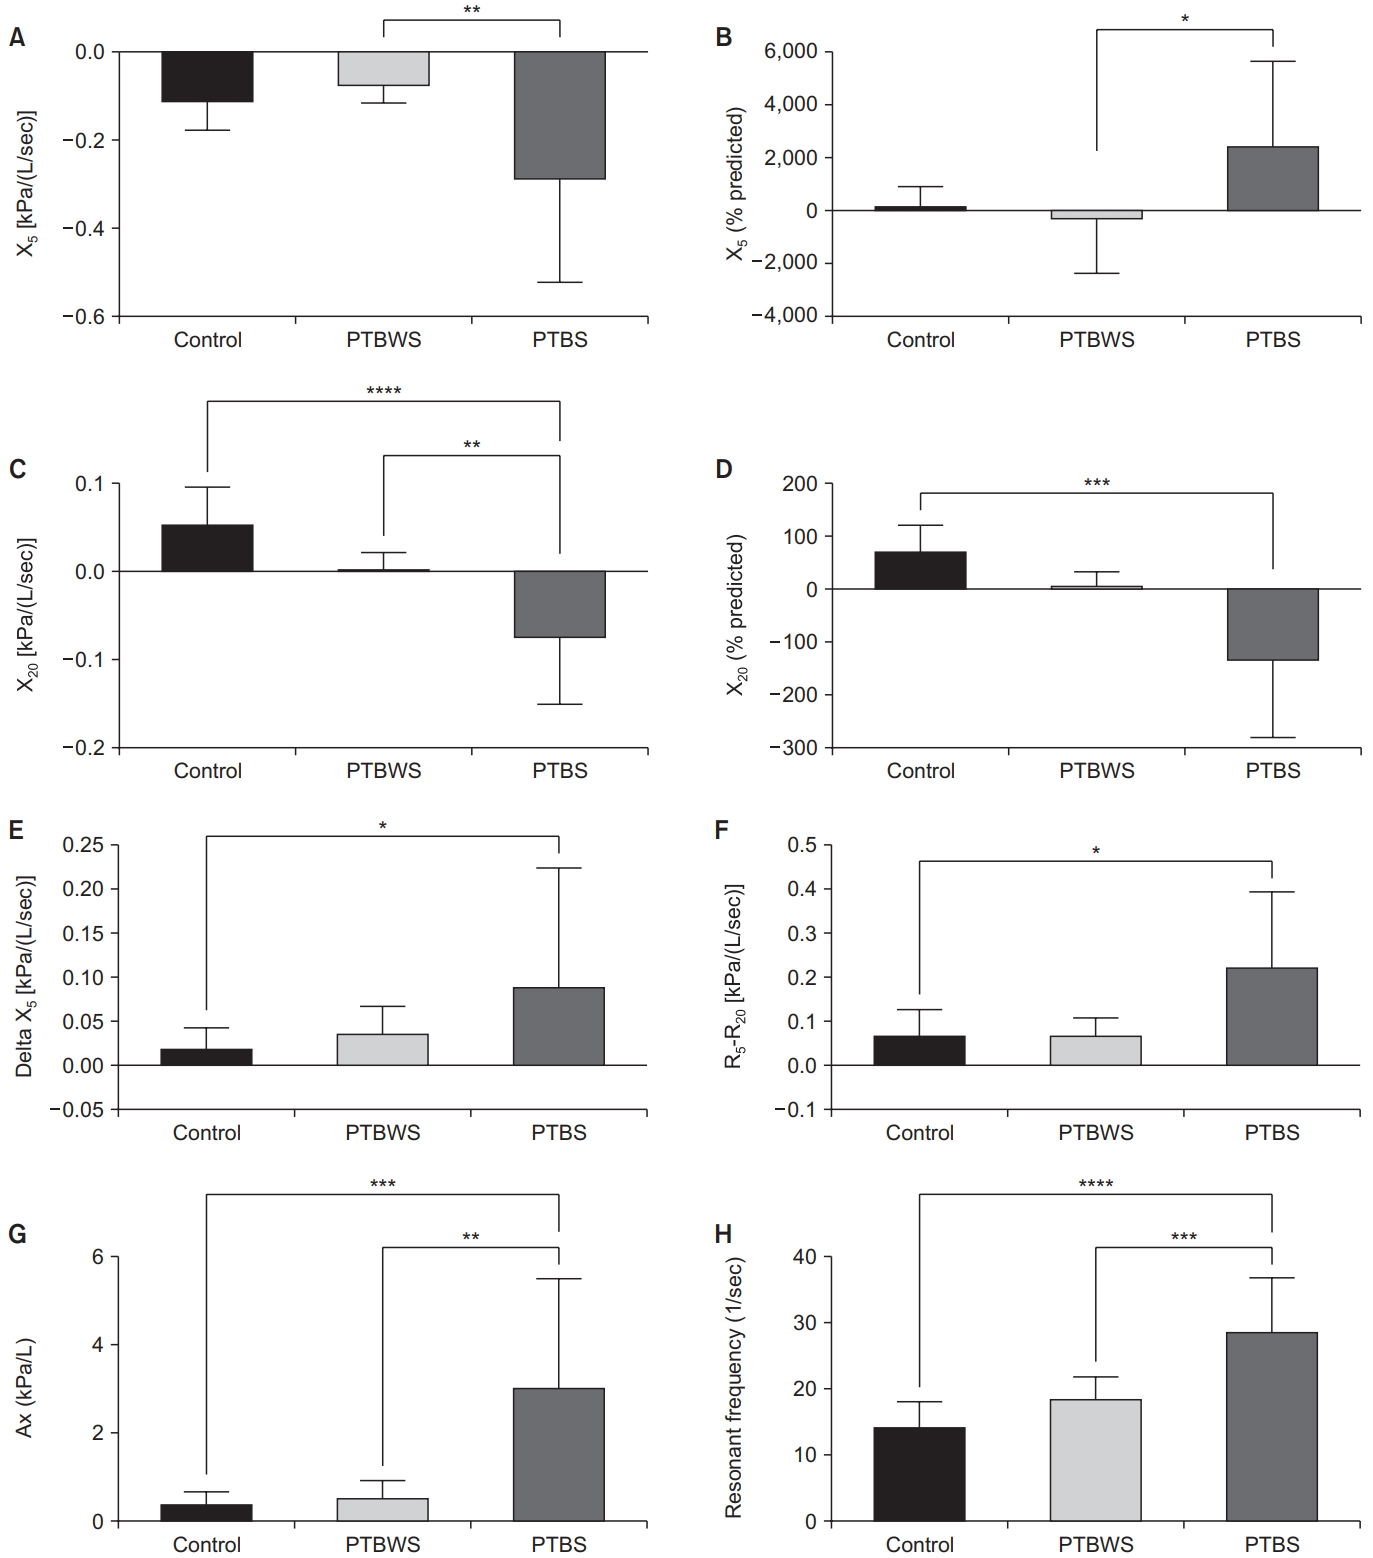
Fig. 2.

Table 1.
| Parameter | Control (n=10) | PTBS (n=10) | PTBWS (n=10) | p-value |
|---|---|---|---|---|
| Age, yr | 37.50±9.95 | 46.20±10.05 | 37.10±9.52 | 0.083 |
| Height, cm | 166.50±14.19 | 158.40±12.63 | 167.90±4.47 | 0.146 |
| Weight, kg | 75.24±17.33 | 54.53±14.24 | 68.86±12.96 | 0.013* |
| BMI, kg/m2 | 26.82±3.07 | 21.60±4.11 | 23.96±3.51 | 0.010* |
| Smoking history | - | - | - | - |
| Sex (male:female) | 5:5 | 5:5 | 10:0 | - |
Table 2.
| Parameter | Control (n=10) | PTBS (n=10) | PTBWS (n=10) | p-value | Multiple comparisons test |
|---|---|---|---|---|---|
| SVC (% predicted) | 86.20±17.20 | 60.60±18.28 | 79.21±10.12 | 0.003** | 0.003**‡ |
| 0.033*§ | |||||
| FVC (% predicted) | 91.70±17.54 | 62.90±18.38 | 80.37±11.00 | 0.001** | 0.001**‡ |
| FEV1 (% predicted) | 85.30±17.18 | 49.50±21.32 | 71.98±11.66 | <0.001*** | <0.001***‡ |
| 0.018*§ | |||||
| FEV1/FVC | 78.05 (74.01-81.08) | 63.21 (56.99-73.80) | 77.88 (70.69-79.19) | 0.048* | 0.044*‡ |
| PEF (% predicted) | 82.00±29.16 | 43.40±24.66 | 45.00±15.84 | 0.001** | 0.004**† |
| 0.003**‡ |
Table 3.
| Parameter | Control (n=10) | PTBS (n=10) | PTBWS (n=10) | p-value | Multiple comparisons test |
|---|---|---|---|---|---|
| Z5 | 0.38±0.12 | 0.63±0.31 | 0.28±0.05 | 0.001** | 0.020*‡ |
| 0.001**§ | |||||
| Z5 (% predicted) | 117.70±28.53 | 195.30±100.80 | 102.30±20.16 | 0.004** | 0.023*‡ |
| 0.006**§ | |||||
| R5 | 0.35±0.11 | 0.55±0.23 | 0.26±0.05 | <0.001*** | 0.021*‡ |
| <0.001***§ | |||||
| R5 (% predicted) | 111.50±27.57 | 171±73.66 | 97.59±19.15 | 0.003** | 0.021*‡ |
| 0.004**§ | |||||
| R20 | 0.31±0.10 | 0.33±0.09 | 0.19±0.02 | 0.002** | 0.012*† |
| 0.002**§ | |||||
| R20 (% predicted) | 93.49±26.91 | 120.40±34.43 | 83.99±9.96 | 0.011* | 0.010*§ |
| Ax | 0.43±0.25 | 3.06±2.43 | 0.56±0.37 | <0.001*** | <0.001***‡ |
| 0.001**§ | |||||
| Fres | 14.39±3.76 | 28.75±7.87 | 18.63±3.21 | <0.001**** | <0.001****‡ |
| <0.001***§ | |||||
| X5 | -0.09 (-0.18 to 0.07) | -0.22 (-0.45 to -0.10) | -0.07 (-0.08 to 0.06) | 0.004** | 0.003**§ |
| X5 (% predicted) | 343.80 (-400 to 750) | 1,163 (235.4 to 5,252) | -375 (-1,387 to 181) | 0.015* | 0.012*§ |
| X20 | 0.05±0.04 | -0.07±0.07 | 0.003±0.01 | <0.001**** | <0.001****‡ |
| 0.004**§ | |||||
| X20 (% predicted) | 100 (27.68 to 111.10) | -113.30 (-267.50 to 16.94) | 12.50 (-12.48 to 27.08) | 0.001*** | <0.001***‡ |
| R5-R20 | 0.05 (0.03 to 0.07) | 0.13 (0.08 to 0.40) | 0.08 (0.03 to 0.10) | 0.009** | 0.011*‡ |
| DeltaX5 | 0.01 (0.01 to 0.02) | 0.04 (0.02 to 0.09) | 0.03 (0.01 to 0.05) | 0.048* | 0.048*‡ |
Table 4.
|
SVC (% predicted) |
FVC (% predicted) |
FEV1 (% predicted) |
FEV1/FVC |
PEF (% predicted) |
||||||
|---|---|---|---|---|---|---|---|---|---|---|
| r value | p-value | r value | p-value | r value | p-value | r value | p-value | r value | p-value | |
| R5 (% predicted)† | -0.715 | 0.019* | -0.725 | 0.017* | -0.776 | 0.008** | -0.606 | 0.063 | -0.719 | 0.019* |
| R5† | -0.750 | 0.012* | -0.768 | 0.009** | -0.787 | 0.006** | -0.551 | 0.098 | -0.726 | 0.017* |
| R20 (% predicted)‡ | -0.477 | 0.163 | -0.483 | 0.157 | -0.470 | 0.170 | -0.359 | 0.308 | -0.555 | 0.095 |
| R20† | -0.511 | 0.130 | -0.530 | 0.114 | -0.489 | 0.151 | -0.300 | 0.399 | -0.582 | 0.077 |
| X5 (% predicted)‡ | -0.565 | 0.093 | -0.600 | 0.073 | -0.636 | 0.054 | -0.430 | 0.218 | -0.697 | 0.030* |
| X5† | 0.704 | 0.022* | 0.736 | 0.015* | 0.720 | 0.018* | 0.494 | 0.146 | 0.669 | 0.034* |
| X20 (% predicted)‡ | 0.695 | 0.030* | 0.674 | 0.036* | 0.784 | 0.009** | 0.601 | 0.070 | 0.826 | 0.004** |
| X20† | 0.681 | 0.029* | 0.677 | 0.031* | 0.777 | 0.008** | 0.602 | 0.065 | 0.661 | 0.037* |
| R5-R20‡ | -0.737 | 0.018* | -0.741 | 0.017* | -0.863 | 0.002** | -0.644 | 0.049* | -0.820 | 0.005** |
| Ax† | -0.733 | 0.015* | -0.741 | 0.014* | -0.827 | 0.003** | -0.652 | 0.040* | -0.742 | 0.014* |
| Fres† | -0.426 | 0.219 | -0.417 | 0.229 | -0.591 | 0.071 | -0.540 | 0.106 | -0.548 | 0.100 |
| Z5 (% predicted)† | -0.695 | 0.025* | -0.716 | 0.019* | -0.747 | 0.013* | -0.566 | 0.088 | -0.704 | 0.022* |
| Z5† | -0.749 | 0.012* | -0.777 | 0.008** | -0.780 | 0.007** | -0.535 | 0.110 | -0.728 | 0.016* |
IOS: impulse oscillometry system; SVC: slow vital capacity; FVC: forced vital capacity; FEV1: forced expiratory volume in 1 second; PEF: peak expiratory flow; R5: resistance at 5 Hz; R20: resistance at 20 Hz; X5: reactance at 5 Hz; X20: reactance at 20 Hz; R5-R20: peripheral airway resistance; Ax: area of reactance; Fres: resonant frequency; Z5: total airway impedance.
Table 5.
IOS: impulse oscillometry system; TB: tuberculosis; AUC: area under the curve; Z5: total airway impedance; R5: resistance at 5 Hz; R20: resistance at 20 Hz; X5: reactance at 5 Hz; R5-R20: peripheral airway resistance; Fres: resonant frequency; Ax: area of reactance; SVC: slow vital capacity; FVC: forced vital capacity; FEV1: forced expiratory volume in 1 second; PEF: peak expiratory flow.
Table 6.
| Control (n=10) | PTBS (n=10) | PTBWS (n=10) | p-value | |
|---|---|---|---|---|
| MMP-1 (ng/mL) | 2.928 (1.136-5.366) | 3.134 (1.847-3.600) | 1.115 (0.866-1.915) | 0.020* |
| TGF-β (ng/L) | 173.7 (120.2-264.5) | 195.3 (147.5-212.6) | 141.1 (111.8-150.5) | 0.100 |
| INF-γ (ng/mL) | 20.62 (17.99-25.80) | 14.20 (12.27-17.98) | 15.59 (10.22-18.65) | 0.102 |
REFERENCES
- TOOLS
-
METRICS

- ORCID iDs
-
Kumar Shanmugasundaram

https://orcid.org/0000-0002-8485-3240Geetanjali Bade

https://orcid.org/0000-0001-6704-820X - Funding Information
-
Department of Physiology, All India Institute of Medical Sciences
- Related articles
-
Surgical Treatment in Pulmonary Tuberculosis
Study on the Candida in Patients with Pulmonary Tuberculosis
Pulmonary Function Test and Diving Capacity of Woman Divers in Cheju Island1989 March;36(1)
A Prospective Study on Initial Treatment Cases of Pulmonary Tuberculosis1988 March;35(1)


 PDF Links
 PubReader
 ePub Link
 Data Sharing Statement
 Full text via DOI
 Print
Print Download Citation


