The Prevalence Rate of Tuberculin Skin Test Positive by Contacts Group to Predict the Development of Active Tuberculosis After School Outbreaks
Article information
Abstract
Background
The tuberculin skin test (TST) is the standard tool to diagnose latent tuberculosis infection (LTBI) in mass screening. The aim of this study is to find an optimal cut-off point of the TST+ rate within tuberculosis (TB) contacts to predict the active TB development among adolescents in school TB outbreaks.
Methods
The Korean National Health Insurance Review and Assessment database was used to identify active TB development in relation to the initial TST (cut-off, 10 mm). The 7,475 contacts in 89 schools were divided into two groups: Incident TB group (43 schools) and no incident TB group (46 schools). LTBI treatment was initiated in 607 of the 1,761 TST+ contacts. The association with active TB progression was examined at different cut-off points of the TST+ rate.
Results
The mean duration of follow-up was 3.9±0.9 years. Thirty-three contacts developed active TB during the 4,504 person-years among the TST+ contacts without LTBI treatment (n=1,154). The average TST+ rate for the incident TB group (n=43) and no incident TB group (n=46) were 31.0% and 15.5%, respectively. The TST+ rate per group was related with TB progression (odds ratio [OR], 1.025; 95% confidence interval [CI], 1.001-1.050; p=0.037). Based on the TST+ rate per group, active TB was best predicted at TST+ ≥ 16% (OR, 3.11; 95% CI, 1.29-7.51; area under curve, 0.64).
Conclusion
Sixteen percent of the TST+ rate per group within the same grade students can be suggested as an optimal cut-off to predict active TB development in middle and high schools TB outbreaks.
Introduction
According to a World health Organization (WHO) report, one-third of the world population is infected with Mycobacterium tuberculosis1. Treatment of latent tuberculosis infection (LTBI) to prevent active TB development in countries with low or intermediate burden is an essential public health strategy to eradicate tuberculosis (TB) worldwide. The candidates for targeted testing for LTBI treatment includes contacts with persons with infectious TB, high risk persons who have underlying medical condition for TB development, and health-care workers with risk for TB infection. There are two approaches to increase targeted testing and LTBI treatment2. One is to promote clinic-based LTBI screening for high risk persons who are under clinician care. The other is to establish public TB control program that targets a subpopulation of persons who are presumed to have LTBI2. Therefore, contact investigation for the students in middle and high school TB outbreaks is an important issue for public TB control program in South Korea where the TB incidence rate is 97/100,0003, while age specific TB incidence of new cases for 15-19 years is 60.9/100,000 in 20104.
In Korea, TB outbreaks are still reported occasionally in schools for adolescents and conglomerate facilities56. Korean guidelines for diagnosis of LTBI as a contact investigation of TB outbreaks in adolescents are as follows7: a tuberculin skin test (TST) alone is recommended for children <5 years old. For children 5-18 years old, either the TST or interferon γ release assay (IGRA) is recommended, but the TST is preferred. However, in the public sector, a two-step strategy (a TST followed by an IGRA) is acceptable for middle and high school TB outbreaks, if TST is positive8.
IGRA and TST are useful tools to diagnose LTBI, and predict active TB development from LTBI. Even though IGRA has recently been used to diagnose LTBI due to several advantages 910, IGRAs are costly, laboratory facility based test. Therefore, TST is still the main standard tool used to diagnose LTBI in mass screening11, especially in children and adolescents for which little evidence exists to support the usefulness of IGRAs1213.
Moreover, TST is used for calculating the annual risk of infection that estimates the real state of TB burden in one population, based on TST positivity rate, even though tuberculin positive responses are affected by factors such as bacille Calmette-Guérin (BCG) vaccination and exposure to nontuberculous mycobacterium infections14. In populations that contain higher number of subjects with LTBI, supposing low rate of false positivity, the distribution of induration size will show a unimodal distribution representing the shifting of high frequency point to the right above 10 mm15. In conditions supposing high TB prevalent state including close TB contacts in case of school TB outbreak, distribution of induration size compared with the normal group can be supporting evidence for LTBI of a TB exposed group15.
The aims of this study were to verify that the TST positivity rate in a contact group exposed to the infectious TB index case can predict active TB development from LTBI state in middle- and high-school TB outbreaks, and to find an optimal cut-off value of TST positivity rate that has highest sensitivity and specificity to predict active TB progression of TB contacts.
Materials and Methods
1. Study population and approach
We used the data for TB outbreaks in 2007 from the Korean Institute of Tuberculosis, which organized response teams for contact investigation, as well as technical cooperation in 2007. The contacts from TB outbreaks that happened in 2007 on entire region of Korea were enrolled. We classified close TB contacts7 as adolescents in the same grade at the same school with index case after TB outbreaks; this included 7,475 students after excluding patients with active TB, abnormal chest radiograph (CXR), or history of TB treatment from 89 schools. During the contact investigation, 13 clusters of 89 groups were identified by DNA fingerprinting for culture-proven secondary TB cases. To investigate the development of active TB progression in contacts from the LTBI, we used the database of the Health Insurance Review and Assessment Service (HIRA) in South Korea. This is a government-affiliated agency, assessing the accuracy of claims for National Health Insurance (NHI, which covers approximately 96.6% of the entire 48.6 million population of South Korea, as a compulsory insurance system) and National Medical Aid (covering approximately 3.5% of the South Korean population)16. The HIRA databases contain the diagnostic code (as per International Statistical Classification of Diseases and Related Health Problems, 10th edition [ICD-10 code]), prescribed medications, and all medical services.
The HIRA databases have been used in other studies171819. Incident TB case was defined as an ICD-10 diagnosis of TB (A15-A19, U88.0-U88.1) and prescription of ≥2 of the following anti-TB drugs: isoniazid, rifampin, ethambutol, pyrazinamide, prothionamide, para-aminosalicylate, and cycloserine. For 5 years, the periods in which the ICD-10 diagnosis were identified in HIRA system were only included for calculating person-years.
2. Tuberculin skin tests
Initially, contact investigation with CXR was conducted to screen the contacts. A TST was performed using 2TU PPD RT23 (Statens Serum Institut, Copenhagen, Denmark) and the Mantoux method. Induration was measured after 48 to 72 hours, and an induration size of 10 mm was adopted as the cut-off value. Even though Quantiferon-TB Gold In-Tube tests (QFT-GIT; Cellestis Ltd., Carnegie, VIC, Australia) was performed as a second step test among TST+ reactors without serial TST for window period, we excluded QFT-GIT results for this analysis. Subjects with LTBI were treated with 6-9 months of isoniazid. The study was approved by the Institutional Review Board (IRB) of the Korea University Ansan Hospital. IRB approved number was AS 12045, and the requirement for informed consent was waived.
3. Statistical analysis
The association between TST and active TB development was examined by logistic regression, and odds ratios (ORs) including 95% confidence intervals of active TB were estimated for TST+ rates. In addition, receiver operating characteristic curves (ROC) were evaluated at different TST+ rates, and the optimal TST+ rate for active TB development was determined at the TST+ rate with the maximum area under curve (AUC). The TB incidence rate was calculated as the number of incident TB cases divided by the number of patients under observation and the duration of observation (person-years). Cox regression was used to determine the relative hazard for TB, adjusted for age and BCG status, with 95% confidence intervals. Summary statistics were analyzed using SPSS version 20.0 (SPSS Inc., Armonk, NY, USA), and logistic regression and ROC analyses were performed using SAS version 9.3 (SAS Institute, Cary, NC, USA).
Results
1. Clinical characteristics of TB contacts and TB outbreak groups
From the classified 89 groups, 7,475 TB contacts were investigated for active TB development for 3.9±0.9 years of mean follow-up. Total person-years of follow-up were 29,218 person-years. The clinical characteristics of the 7,475 subjects were presented in Table 1.

Clinical characteristics of TB contacts
Four thousand and sixty-six (54.4%) contacts were males and 3,409 (45.6%) were females. The mean age of contacts was 17 years (range, 12-19 years). Five thousand, two hundred and eight contacts (69.7%) had BCG scars. The numbers of contacts with TST+ (≥10 mm) were 1,861 (17.8%). The baseline CXRs of the 7,475 contacts were normal. The above 7,475 contacts could be summarized as Figure 1 based on the TST results and initiation of LTBI treatment. Of the 1,761 contacts with TST+, 607 started to initiate LTBI treatment. The duration of follow-up was 22,360 person-years for the TST-group (n=5,714), 2,355 person-years for the LTBI treatment initiation group (n=607), and 4,504 person-years for no LTBI treatment group (n=1,154). Finally, the total 7,475 contacts were divided into two groups to find an optimal TST cut-off point, as follows: incident TB group (43 schools), no incident TB group (46 schools).
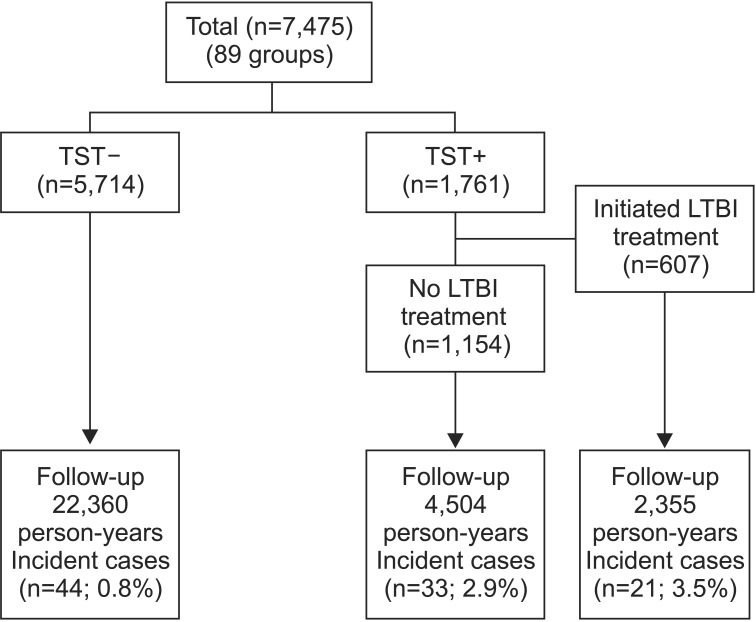
Flow diagram for TB contacts of infectious patients with tuberculosis. TB: tuberculosis; TST: tuberculin skin test; LTBI: latent tuberculosis infection.
When total contacts were reclassified as 89 groups according to the same grade at same school, the clinical characteristics were listed in Table 2. Forty-nine groups (55%) were coeducational. The average student numbers per group were 87 (standard deviation, ±143). Average BCG scar+ rates per group was 72.5%. Average TST+ rate per group was 23.1%. Finally, 43 of 89 groups had at least one active TB progression till the 5-year follow-up.

Clinical characteristics of TB outbreak groups containing TB contacts exposed to each index case
2. Accumulated hazard by TST status
Among those with TST induration ≥10 mm, and excluding contacts who initiated LTBI treatment, the rates of TB progression per 1,000 person-years were as follows: TST+ 7.3 (33/4,504); and TST- 2.0 (44/22,360). When adjusted for age and BCG scar, the hazard ratio (HR) was significantly higher in the TST+ group than in the TST- group (HR, 3.85; 95% confidence interval [CI], 2.43-6.10; p<0.001). Moreover, this HR was more distinct after excluding contacts who initiated LTBI treatment from 3.80 to 3.85 (Table 3).

Adjusted HRs for active TB using TST test in Cox proportional hazard analysis
3. Predictive factor for active TB development of TB contacts
As shown in Figure 1, of the 5,714 contacts who had baseline TST- results, active TB developed in 44 contacts (TB incidence, 44 cases [0.8%]). Among 1,761 contacts with baseline TST+ results, active TB developed in 21 of the 607 contacts (3.5%) who had initiated LTBI treatment, and in 33 of the 1,154 contacts who had not initiated the LTBI treatment (2.9%).
As shown in Table 4, average TST+ rate for incident TB group and no incident TB group were 31.0% and 15.5%, respectively. In multivariate analysis, TST+ rate per group was related with TB progression during follow-up (OR, 1.025; 95% CI, 1.001-1.050; p=0.037). However, mean age per group (OR, 1.043; 95% CI, 0.746-1.460; p=0.804), BCG scar rate per group (OR, 1.005; 95% CI, 0.988-1.023; p=0.556), and initiation of LTBI treatment (OR, 0.983; 95% CI, 0.960-1.008; p=0.184] were not related with TB progression during follow-up.

Significance test results for TB progression among TB outbreak group
4. TST cut-off value to predict the TB progression of TB contact members
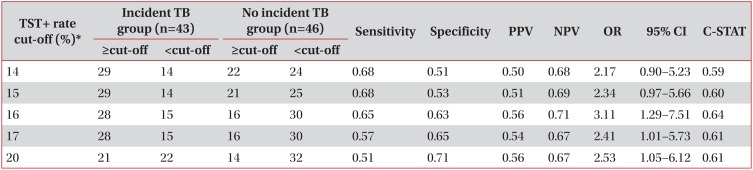
According to each TST+ cut-off level (LTBI rate of each group), the number of groups where at least one active TB developed (incident TB group) and that of groups where no active TB developed (no incident TB group) were presented in Table 5. At the 16% (OR, 3.11; 95% CI, 1.29-7.51; C-STAT, 0.64) and 17% point (OR, 2.41; 95% CI, 1.01-5.73; C-STAT, 0.61) of TST+ rate per group, there were significant differences in active TB development from LTBI among TB contacts group. Using C-statistics, AUC was highest in the TST+ 16% cut off point as 0.64 (OR, 3.11;95% CI, 1.29-7.51) (Table 5).

TST cut-off value to predict the TB progression of group members
Discussion
TST positivity rate in a contact group exposed to the infectious TB index case was a predictive factor for development of active TB patient among TB contacts in middle- and highschool TB outbreaks in our study. Moreover, 16% TST positivity rate could be an optimal cut-off value to consider close contacted same grade students as a recent exposure group which will bring about active TB incidence from LTBI. This study can be a critical steppingstone for school TB outbreak control, because we searched patients with active TB developed from LTBI in middle and high schools all over the country through indirect medical data base. Furthermore, this evidence will assist LTBI control as an accessory contact investigation tool, because confirmatory IGRA tests added to TST are currently conducted in the public health field for confirmation of LTBI diagnosis for middle and high school TB outbreaks8.
In our study, average TST+ rate per group was 23.1±26.2%, which was much higher than the average 14.1% TST+ rate in normal adolescents in Korea20. This result can be related to the contacts' heavy exposure to infectious TB sources. The positive rate of TST in each close contact group was between 22% and 93%. In two schools, contact duration time that can influence the group TST+ rate21 were as long as 3 months, because subsequent Quantiferon-Gold In Tube (QFT) test were conducted so lately for the final decision of LTBI treatment. However, the false positive rate due to BCG revaccination was supposed to be minimal, because most TB contacts were subjects to whom the abandoned BCG revaccination programs since 1997 were not applied20.
TB transmission is considered if a secondary case is identified in any contacts, if there are TST converters, or if TST+ prevalence rate among contacts is higher than the rate of a similar population without recent exposure22. Considering the TST positivity rate of normal youth as 14.1% in large scale survey in South Korea20, this cut-off point nearly corresponded to our study's result in which the 16% point of TST+ rate per group was the initial point that caused differences in active TB development from LTBI among TB contacts groups (OR, 3.11; 95% CI, 1.29-7.51; AUC, 0.64). When index case is acidfast bacilli (AFB) smear (-) with suspected infectivity during turn around time period for AFB culture, the TST+ rate of TB contact adolescent group ≥16% can be a clue to proceed to the next step, such as confirmatory interferon-gamma release assay tests to confirm the LTBI of contacts for LTBI treatment. Considering C-STAT (AUC) of TST+ rate that showed the highest sensitivity and specificity point of 16%, we can suggest the optimal cut-off point as 16% for the prediction of a TB contacts group's true infection state that will result in active TB incidence from LTBI. Considering the TB incidence rate as 770/100,000 (44 active TB patients among 5,714 contacts) in TST negative contacts in our study, second step TST after 8-10 weeks since last contact must be performed to exclude false negatives, especially when TST+ rate is ≥16%. Given that adjusted HR compared with TST- group was increased from 3.8 to 3.85 if contacts who initiated LTBI treatment were excluded to exclude any LTBI treatment effect, the effect of LTBI treatment should not be underestimated.
For IGRA, QFT result shows indeterminate result in 5% of immune-compromised patients23, and in 4.7% of patients receiving dialysis24. Moreover, the frequencies of indeterminate results in children reach 17% depending on the IGRA format and filed situations25. IGRA performance in children is less well understood than IGRA performance in adults, and indeterminate results for children are a potential limitation to implementing IGRA tests in clinical routine practice. Therefore, a TST positive rate of ≥16% in a TB outbreak group is supposed to be additionally helpful to consider TB contacts with indeterminate IGRA results as real LTBI state in adolescents.
There are some limitations to our study. First, identified active TB patients contain clinical TB without AFB culture confirmation, even though TB medications were prescribed simultaneously. Also, in cases of culture-proven active TB, we were unable to demonstrate that the TB strain in patients with active progression were the same pathogens, as in the index cases of a previous TB outbreak, because it was impossible to trace the active TB subject through the identification number due to laws protecting personal information in South Korea. Second, because we could not sure that LTBI treatments were completely performed with full compliance for TB contacts with LTBI, we could not completely exclude the effects of LTBI treatment for the analysis. Third, we could not get enough information on contact duration time of TB contacts, number of BCG scar of TB contacts that can influence the TST result in initial contact investigation. Last, the numbers of TB contacts in each group for contact investigation were wide between groups.
Despite these limitations, in school TB outbreak among adolescents, TST positive rate of 16% can be suggested as a cutoff point that has highest sensitivity and specificity to predict active TB progression of contacts in a contact group exposed to the infectious TB index case.
Acknowledgements
We thank Woo Jin Lew, former director of the Korean Institute of Tuberculosis, and all members of the technical cooperation department for assistance in data collection and cleaning. We thank the Korean TB study group for accommodating our research fund. Above all, we thank the Health Insurance Review & Assessment Service (HIRA) in South Korea for their permission for data access and analysis.
This study was funded by a 2013 grant for a Korean TB Study Group from the Korean Academy of Tuberculosis and Respiratory Disease.
Notes
Conflicts of Interest: No potential conflict of interest relevant to this article was reported.