

Introduction
The 3 months mortality rate of patient with acute pulmonary embolism accompanied with hemodynamic stability has been known as 3~15% depending on different studies1,2. In particular, in case of massive pulmonary embolism accompanied with right ventricular dysfunction and hemodynamic instability, the 90 days mortality rate is nearly 25% to 52.4%3,4. The sub-massive acute pulmonary embolism does not accompany any hemodynamic instability but it accompanies the right ventricular dysfunction with poor prognosis2.
In case of acute pulmonary embolism accompanied with hemodynamic stability, it shows comparatively good prognosis with the mono-therapy of palliative anticoagulation5. However, for treatments of massive or sub-massive pulmonary embolism, such as thrombolysis, surgical or interventional thrombectomy can be considered in order to resolve right ventricular dysfunction or shock in addition to the palliative anticoagulation5. Nevertheless, anticoagulation has risk of bleeding whereas invasive thrombectomy can cause perforation of cardiac structures or cardiac tamponade as complications therefore use of anticoagulation should be determined prudently depending predictable prognosis6.
In several studies, there had been reports that the increased diameter ratio of right ventricle against left ventricle measured from the pulmonary computed tomography (CT) angiography was related to the poor prognosis of acute pulmonary embolism7,12. But, the diameter ratio of right ventricle against left ventricle measured from the CT angiography has demerit with large inter-observer or intra-observer variability13. Hence, there is a need for objective prognostic factors that can predict the outcomes of pulmonary embolism.
To this end, the authors established a hypothesis that in case of massive or sub-massive acute pulmonary embolism with poor prognosis, the migration of contrast agent is not achieved smoothly from right circulation or right ventricle to left circulation or aorta during the first pass phase, resulting in reduction of ratio of the descending aorta enhancement to main pulmonary artery enhancement, and this finding is likely to have better inter-observer agreement in comparison to the diameter ratio of right ventricle against left ventricle.
In this study, the authors aimed to evaluate whether measuring the ratio of the descending aorta enhancement to main pulmonary artery enhancement can be helpful for predicting the prognosis of patient with massive or sub-massive acute pulmonary embolism.
Materials and Method
1. Patient group
With retrospective analysis of electronic medical records and the reading reports of Radiology Department, 69 patients were identified, who were diagnosed as acute pulmonary embolism with no artifact on the pulmonary CT angiography and to whom both of pulmonary CT angiography and transthoracic echocardiography were performed from January of 2007 to October of 2011. The cases with interval between undertakings of transthoracic echocardiography and pulmonary CT angiography was ≥3 days (n=14), the cases with no finding of right ventricular dysfunction on the transthoracic echocardiography (n=14) and the cases with findings of right ventricular dysfunction on the previously performed transthoracic echocardiography (n=4) were excluded from the study.
The right ventricular dysfunction found from transthoracic echocardiography was defined as the case that had shown any of the following three findings5.
1) The ratio of the right ventricular end-diastolic diameter to the left ventricle end-diastolic diameter is ≥0.9; 2) The wall motion abnormality of right ventricle; 3) The tricuspid regurgitation jet is ≥2.8 m/sec.
A retrospective analysis was conducted in 37 patients (male/female, 7/30 patients; age, 68.9±13 years) who were conformed to the study conditions. The patients having right ventricular dysfunction only with no hemodynamic instability were diagnosed as sub-massive acute pulmonary embolism while the patients having right ventricular dysfunction accompanied with hemodynamic instability were diagnosed as massive acute pulmonary embolism. The hemodynamic instability was defined as the cases with systolic blood pressure (BP) ≤90 mm Hg or the cases accompanied with syncope.
The patient group from whom the major adverse events had incurred regardless the causes was categorized as group Ia, the patient group from whom the acute pulmonary embolism-associated major adverse events was categorized as group Ib and the patient group from whom no major adverse event had incurred was categorized as group II. The major adverse event was defined as the cases of deaths within 1 month from being diagnosed as acute pulmonary embolism, or the cases with severe complications that required endotracheal intubation or cardiopulmonary resuscitation (CPR). The cases with other definite causes of the major adverse events such as sepsis or acute respiratory distress syndrome were considered as having no association with acute pulmonary embolism.
2. Clinical variables
Retrospective analyses were performed for the age, gender, main presenting symptom, presence/absence of massive acute pulmonary embolism, the left ventricular ejection fraction measured by transthoracic echocardiography, in-patient period, treatment methods, presence/absence of pulmonary embolism-induced severe complications and the death by using the electronic medical records. The presence/absence of massive acute pulmonary embolism was identified by measuring systolic BP at the time of diagnosis and the treatment method was examined whether used the administration of anticoagulation agent only or used the co-administration of thrombolytic agent with anticoagulation agent.
3. Pulmonary CT angiography and transthoracic echocardiography
The pulmonary CT angiography was performed in use of 16-Slice Multi-Detector Row CT (Lightspeed VCT; GE Healthcare, Milwaukee, WI, USA). The scanning range was set as from thoracic inlet to upper abdomen. After scanning with 0.625 mm thick slice, reconstructive images were acquired with 2 mm slice. Fifty mL Ioversol (Optiray 320; Mallinckrodt Medical, St. Louis, MO, USA) was infused at the rate of 4 mL/sec into an antecubital vein, followed by infusion of 50 mL saline solution at the rate of 4 mL/sec. Scanning was commenced 5 seconds after from the time point that the pulmonary artery reaches 100 Hounsfield unit (HU) by using Bolus tracking technique (Smart Prep; GE Medical Systems). The window level and width for the interpretation of CT images were 200 and width as 800, respectively.
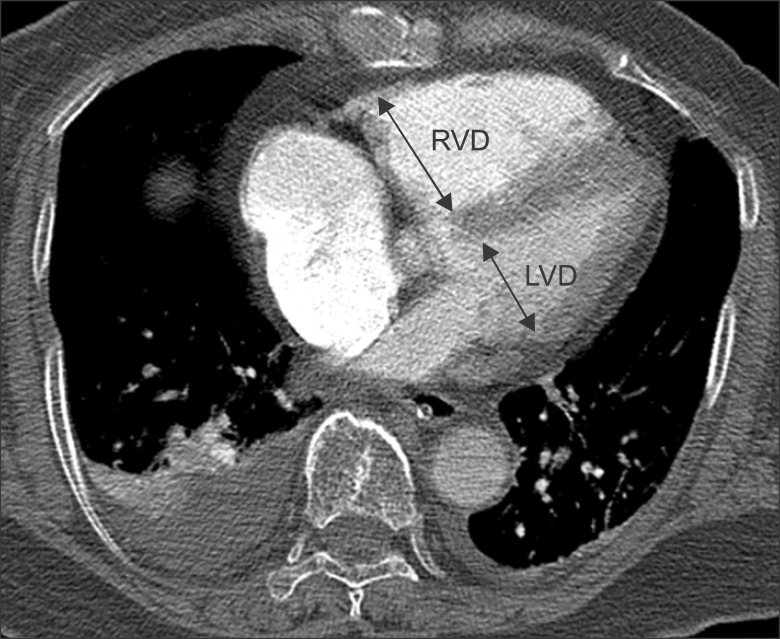
CT findings were analyzed by two radiologists independently. Thereafter one radiologist had analyzed the results of transthoracic echocardiography and the medical record. The location of largest pulmonary artery was evaluated from where the pulmonary embolism was identified and the ratio of the descending aorta enhancement to main pulmonary artery enhancement as well as the diameter ratio of right ventricle to left ventricle was measured from the CT images. The location of largest pulmonary artery where the pulmonary embolism was present was recorded as divided into main pulmonary artery, lobar pulmonary artery, segmented pulmonary artery and sub-segmented pulmonary artery. For the ratio of the descending aorta enhancement to main pulmonary artery enhancement, HU of pulmonary artery was measured at the widest area as possible of main pulmonary artery on an trans-axial CT image from where the main pulmonary artery branches to the left and the right pulmonary arteries, and HU of descending aorta was measured from the same level (Figure 1). The diameter of right and left ventricle was measured vertically to each ventricular long axis on a trans-axial CT image above the coronary sinus (i.e., the longest distance from inter-ventricular septum to the endocardial margin on the lateral wall of left ventricle) (Figure 2).
4. Statistical analysis
SPSS version 19.0 (SPSS Inc., Chicago, IL, USA) was employed for the statistical analysis. Mann-Whitney U-test was used for continuous variables while Fisher's exact test was used for discrete variables in order to analyze respective demographic characteristics, differences in treatment and prognosis of each patient group. Mann-Whitney U-test was also used to analyze the ratio of the descending aorta enhancement to main pulmonary artery enhancement as well as the diameter ratio of right ventricle vs. left ventricle between group Ia and group II as well as between group Ib and group II. To evaluate variability between two observers, the intra-class correlation coefficient had been measured. When p-value was less than 0.05, it was determined to have statistically significant differences.
Results
Among the study subjects, there were 25 cases with sub-massive acute pulmonary embolism and 12 cases with massive acute pulmonary embolism. The interval between undertakings of pulmonary CT angiography and transthoracic echocardiography was 0.14±2.10 days.
There were 6 cases with mortality, one case with CPR, and one case with endotracheal intubation and ventilator care. Therefore, the major adverse events had incurred from 8 patients in total. 3 of them had died of acute renal failure, sepsis and acute respiratory distress syndrome which were considered as major adverse events unassociated with the acute pulmonary embolism. Accordingly, the study subjects were classified into group Ia (n=8), group Ib (n=5), and group II (n=29). Group II had shown higher percentage of patients (p=0.004, p=0.005) whose main complaint was dyspnea but has shown lower percentage of patients whose main complaint was change of consciousness (p=0.042, p=0.018) or cardiac arrest (p=0.007, p=0.018) in comparison to group Ia and group Ib. For the left ventricular ejection fraction, there were no statistically significant difference between group Ia and group II but group Ib had shown lower mean value than group II which was statistically significant (p=0.034). There was no statistically significant inter-group difference in the largest pulmonary artery with pulmonary embolism (Table 1). The follow up period after the initial diagnosis was 337±367.7 days and from group Ia and group Ib all major adverse events had incurred within 1 month. From group II, there were no major adverse events or recurrences.
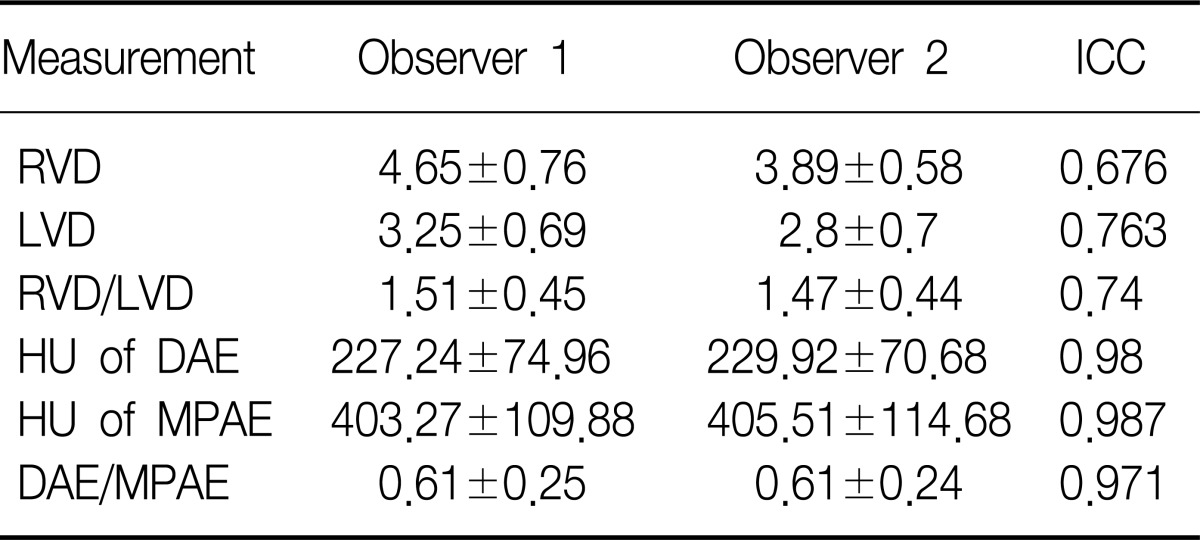
The intra-class correlation coefficient of the diameter ratio of right ventricle to left ventricle and that of the ratio of the descending aorta enhancement to main pulmonary artery enhancement, were 0.74 and 0.97, respectively (Table 2).
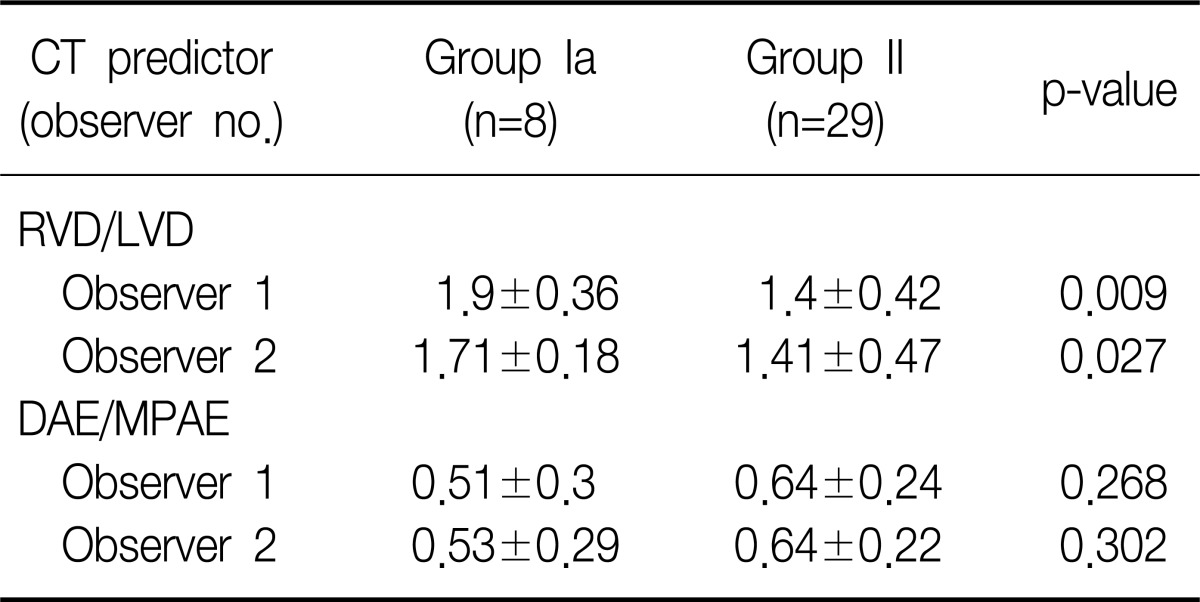
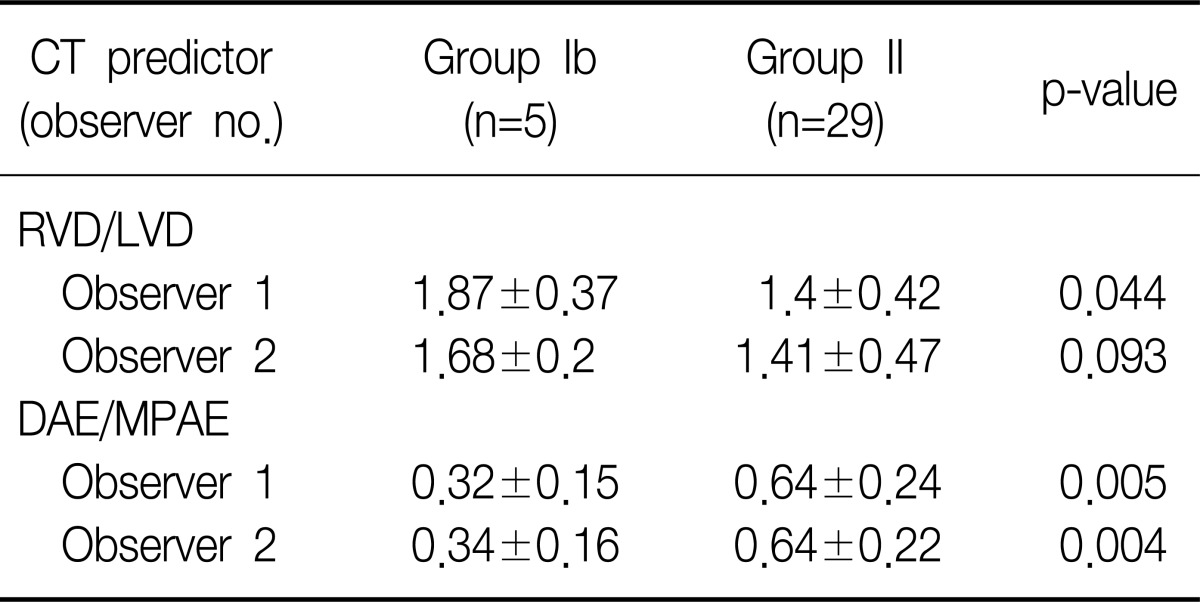
The observer 1 had measured the diameter ratio of right ventricle vs. left ventricle in group Ia, group Ib, and group II as 1.9±0.36, 1.87±0.37, and 1.4±0.42, respectively, while the observer 2 had measured those as 1.71±0.18, 1.68±0.2, and 1.41±0.47, respectively. The diameter ratio of right ventricle vs. left ventricle in group Ia was higher than that of group II in the both observers, and this difference was statistically significant for both of the observer 1 (p=0.009) and the observer 2 (p=0.027) (Table 3). The diameter ratio of right ventricle vs. left ventricle of group Ib was also higher than that of group II for in both observers and the difference was statistically significant in the observer 1 (p=0.044), but not in the observer 2 (p=0.093) (Table 4).
The observer 1 had measured the ratio of the descending aorta enhancement to main pulmonary artery enhancement in group Ia, group Ib, and group II as 0.51±0.3, 0.32±0.15, and 0.64±0.24, respectively, while the observer 2 had measured those as 0.53±0.29, 0.34±0.16, and 0.64±0.22, respectively. The ratio of the descending aorta enhancement to main pulmonary artery enhancement measured from group Ia and from group II had not shown any statistically significant differences for both of the observer 1 (p=0.268) and the observer 2 (p=0.302) (Table 3). The ratio of the descending aorta enhancement to main pulmonary artery enhancement measured from group Ib was lower than that of group II and such difference was statistically significant for both of the observer 1 (p=0.005) and the observer 2 (p=0.004) (Table 4).
Discussion
The pulmonary CT angiography is widely performed in patients with clinical suspicion of pulmonary embolism, as a reference standard for diagnosis of pulmonary embolism. There had been various attempts to use pulmonary CT angiography not only for diagnosis of pulmonary embolism but for its prognostic prediction. It has been known that the diameter ratio of right ventricle vs. left ventricle is the most important predictive factor for the prognosis of pulmonary embolism14,15. However, the diameter ratio of right ventricle vs. left ventricle has demerit of relatively large inter-observer variability13. Thus, the authors conducted a study on the ratio of the descending aorta enhancement to main pulmonary artery enhancement as objective prognostic factor with better inter-observer agreement.
In this study, the diameter ratio of right ventricle vs. left ventricle measured from group Ib and group II by one observer did not show any statistically significant differences (1.68±0.2 vs. 1.41±0.47, p=0.093). Although the possibility of measurement error by the radiologist cannot be ruled out completely, such outcomes may indicate that measuring the diameter ratio of right ventricle vs. left ventricle has subjective elements. Although there had been multiple studies indicating that the diameter ratio of right ventricle vs. left ventricle can predict on the outcomes of acute pulmonary embolism7-12, several studies had also reported the contradictory results to the previous reports13,16. In particular, in one study, inter-observer variability was relatively large in measuring the diameter ratio of right ventricle vs. left ventricle (intra-class correlation coefficient=0.51)13. First, this large inter-observer variability is caused by the fact that the diameter is measured on the trans-axial CT image, rendering the measurement inaccurate (i.e., due to individual variation of the cardiac axis on the trans-axial CT image). Second, each observer may select a different trans-axial image for the measurement. Third, because electrocardiographic gating images are not used on the pulmonary CT angiography, motion artifacts on the boundary of endocardium may result in inaccurate measurement. Several investigators used multi-planar reformatted image technique such as 4-chamber view or volume measurement of ventricles to supplement such shortcomings17-19. However, these methods are somewhat not practical and time-consuming. In this study, the intra-class correlation coefficient (intra-class correlation coefficient=0.74) for the diameter ratio of right ventricle vs. left ventricle was higher than that of previous studies thereby it is considered that subsequent further studies on this would be required.
The authors predicted that the more contrast agents are retained in the pulmonary circulation as the right ventricular dysfunction caused be pulmonary embolism is severer, resulting in the decrease of the descending aorta enhancement. The ratio of the descending aorta enhancement to main pulmonary artery enhancement between group Ia and group II was no statistically significant difference in the both observers (0.51±0.3 vs. 0.64±0.24, p=0.268; 0.53±0.29 vs. 0.64±0.22, p=0.302). In contrast, the ratio of the descending aorta enhancement to main pulmonary artery enhancement of group Ib was significantly lower than that of group II in both observers (0.32±0.15 vs. 0.64±0.24, p=0.005; 0.34±0.16 vs. 0.64±0.22, p=0.004).
The ratio of the descending aorta enhancement to main pulmonary artery enhancement between group Ia and group II did not show any difference because the ratio of the descending aorta enhancement to main pulmonary artery enhancement was measured higher than 0.7 in all of 3 patients who were belonged to group Ia but not to group Ib. These 3 patients had small amount of the volumes of pulmonary embolism on their pulmonary CT angiography and manifest causes of death such as acute renal failure, sepsis or acute respiratory distress syndrome. Moreover, they had very high degree of intra-class correlation coefficient (intra-class correlation coefficient=0.989) from the ratio of the descending aorta enhancement to main pulmonary artery enhancement. High inter-observer agreement of the ratio of the descending aorta enhancement to main pulmonary artery enhancement was caused by the fact that this measurement has no or minimal artifacts to affect the measurement, and it is likely to obtain nearly equal values, even if the observers select different cross-sectional image for the measurement.
In a previous study, 1.5 (the diameter ratio of right ventricle vs. left ventricle) had been suggested as a cut-off value representing massive pulmonary embolism with poor prognosis14. In the present study, 7 of 8 patients with poor prognosis in group Ia had higher diameter ratio of right ventricle vs. left ventricle than 1.5, but one patient had the diameter ratio of right ventricle vs. left ventricle as 1.375. In contrast, ratio of descending aortic enhancement to main pulmonary artery enhancement measured in this patient was 0.23 far lower than the mean (0.6±0.22).
In the present study, the left ventricular ejection fraction in group Ia and group Ib was lower than that of group II. Nevertheless, the statistical significance was observed only between group Ib and group II (p=0.034). This result may imply that low level of left ventricular ejection fraction is related to the poor prognosis of pulmonary embolism19. There was no difference in the location of largest pulmonary artery with an embolus among the three groups in this study, although its prognostic impact is still controversial14.
This study has a few limitations. First, the study samples were small and the result could be biased as a retrospective analysis. Second, 3 patients who died of acute renal failure, sepsis and acute respiratory distress syndrome were classified as deaths unrelated to the pulmonary embolism, but the likelihood of pulmonary embolism to have additional effects on the prognosis cannot be completely ruled out, even if it would not be the direct cause of death. However, there were clear direct causes of death in these 3 patients in addition to pulmonary embolism and it is factual that the volumes of pulmonary occlusion in them were not big on the pulmonary CT angiography. Third, the heart rate of patients was not identifiable at the time of performing CT scanning. Hence, the difference in contrast enhancement of aorta induced by the variation of heart rate was not assessed in this study. Further studies will be required.
In conclusion, the ratio of descending aortic enhancement to main pulmonary artery enhancement proposed by the authors may not be likely to predict all deaths and severe complications unrelated to the causes, but it was able to predict on the pulmonary embolism-associated deaths and severe complications. Therefore, it is considered that this ratio can be used as additional prognostic factor along with the already known prognostic factor, which is the diameter ratio of right ventricle vs. left ventricle. There is also a merit that it is more objective measurement than any other prognostic factors.


 PDF Links
 PubReader
 Full text via DOI
 Print
Print Download Citation