 |
 |
| Tuberc Respir Dis > Volume 86(2); 2023 > Article |
|
Abstract
Background
Methods
Results
Notes
AuthorsŌĆÖ Contributions
Conceptualization: Heo IR, Kim HC. Methodology: Heo IR, Kim HC. Formal analysis: Heo IR, Kim HC. Data curation: Kim HC. Software: Heo IR, Kim HC. Validation: Kim HC. Writing - original draft preparation: Heo IR, Kim HC. Writing - review and editing: Kim TH, Ju SM, Yoo JW, Lee SJ, Cho YJ, Jeong YY, Lee JD. Approval of final manuscript: all authors.
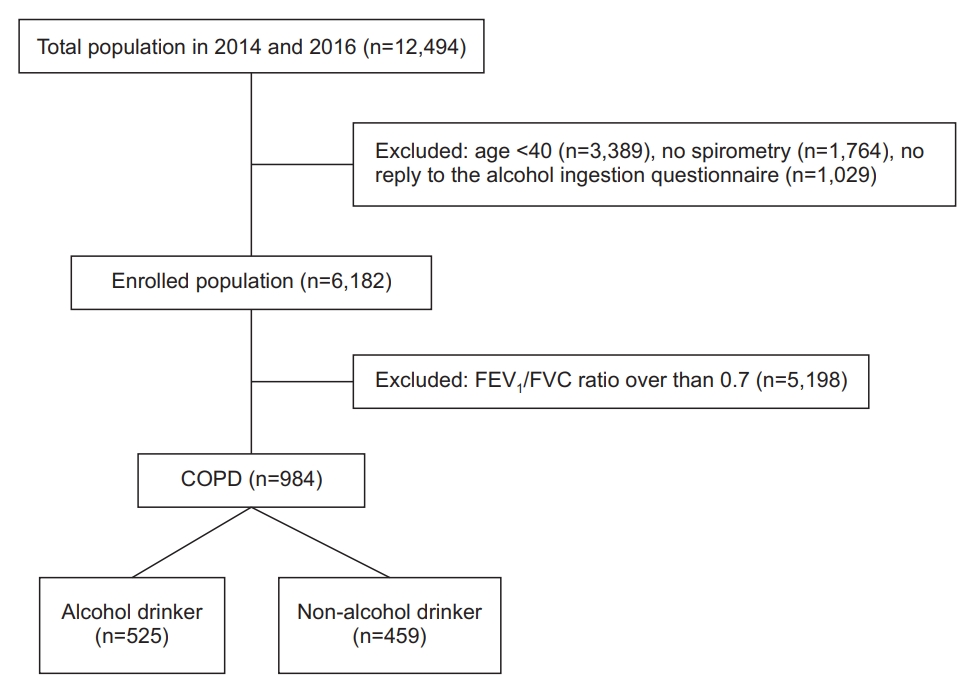
Fig.┬Ā1.

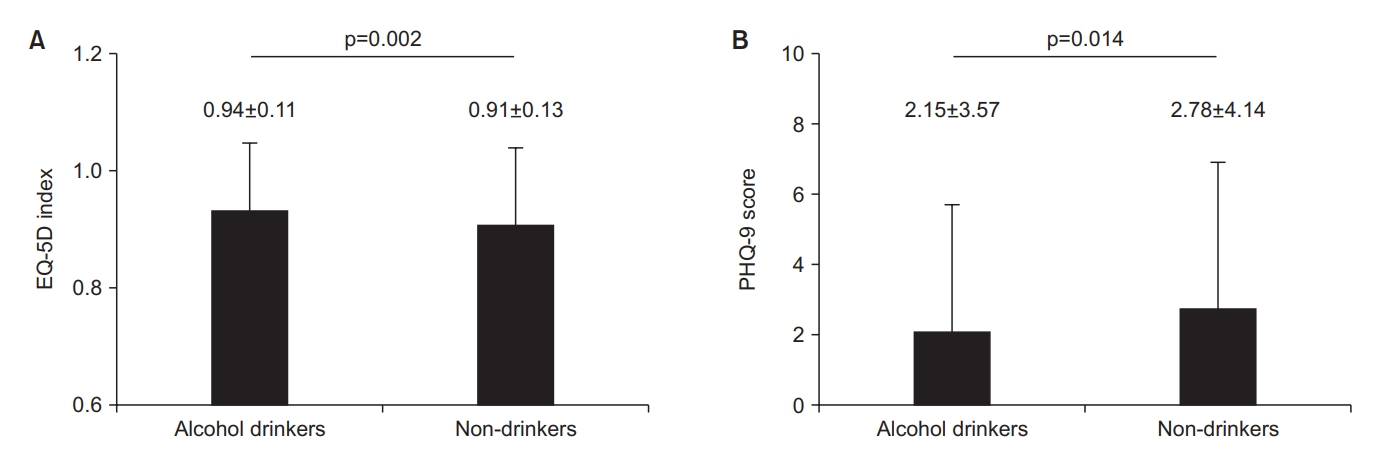
Fig.┬Ā2.

Table┬Ā1.
| Characteristic | Alcohol drinkers (n=525) | Non-alcohol drinkers (n=459) | p-value | |
|---|---|---|---|---|
| Age, yr | 63.7┬▒10.0 | 68.2┬▒8.78 | 0.000 | |
| Male sex | 447 (85.1) | 78 (14.9) | 0.000 | |
| BMI, kg/m2 | 24.1┬▒2.87 | 23.7┬▒3.14 | 0.034 | |
| Smoking status | ||||
| ŌĆāCurrent smoker | 167 (31.8) | 95 (20.7) | 0.000 | |
| ŌĆāNever smoked | 108 (20.6) | 232 (50.5) | 0.000 | |
| ŌĆāEx-smoker | 250 (47.6) | 132 (28.8) | 0.000 | |
| Alcohol consumption | ||||
| ŌĆāLight to moderate-risk | 318 (60.6) | |||
| ŌĆāHigh-risk | 207 (39.4) | |||
| PFT | ||||
| ŌĆāFEV1, L | 2.49┬▒0.6 | 2.03┬▒0.61 | 0.005 | |
| ŌĆāFEV1, % predicted | 80.5┬▒14.6 | 78.4┬▒17.1 | 0.036 | |
| ŌĆāFVC, L | 3.87┬▒0.83 | 3.19┬▒0.88 | 0.000 | |
| ŌĆāFVC, % predicted | 91.3┬▒13.3 | 88.5┬▒15.8 | 0.000 | |
| ŌĆāFEV1/FVC, L | 0.64┬▒0.06 | 0.63┬▒0.07 | 0.116 | |
| Underlying disease | ||||
| ŌĆāHypertension | 218 (41.5) | 184 (40.1) | 0.083 | |
| ŌĆāIschemic heart disease | 26 (5.1) | 24 (5.4) | 0.961 | |
| ŌĆāStroke | 6 (1.1) | 14 (3.1) | 0.055 | |
| ŌĆāDiabetes | 71 (13.5) | 80 (17.4) | 0.220 | |
| ŌĆāArthritis | 57 (11.2) | 100 (22.5) | 0.000 | |
| ŌĆāCRF | 3 (0.6) | 1 (0.2) | 0.590 | |
| ŌĆāLC | 1 (0.2) | 3 (0.7) | 0.427 | |
| ŌĆāLung cancer history | 5 (1) | 0 | 0.926 | |
| ŌĆāPulmonary TB history | 37 (7.0) | 45 (9.8) | 0.241 | |
| ŌĆāDepression history | 13 (2.5) | 17 (3.7) | 0.445 | |
| Laboratory finding (n=939) | ||||
| ŌĆāGlucose, mg/dL | 107.7┬▒25.3 | 103.8┬▒23.9 | 0.016 | |
| ŌĆāAST, IU/L | 24.9┬▒7.17 | 22.6┬▒7.16 | 0.001 | |
| ŌĆāALT, IU/L | 22.9┬▒13.8 | 20.5┬▒11.5 | 0.004 | |
| ŌĆāHemoglobin, g/dL | 14.8┬▒1.31 | 13.8┬▒1.45 | 0.000 | |
| ŌĆāHematocrit, % | 44.4┬▒3.68 | 42.1┬▒4.08 | 0.000 | |
| ŌĆāBUN, mg/dL | 15.9┬▒4.47 | 16.49┬▒4.81 | 0.049 | |
| ŌĆāCreatinine, mg/dL | 0.82┬▒0.20 | 0.89┬▒0.22 | 0.027 | |
| Nutritional intake (n=845) | ||||
| ŌĆāFood, g | 1,616.5┬▒809.4 | 1,381┬▒719.8 | 0.000 | |
| ŌĆāWater, g | 1,146.7┬▒711.7 | 958.1┬▒608.0 | 0.000 | |
| ŌĆāCalories, kcal | 2,081.0┬▒767.1 | 1,787.7┬▒716.5 | 0.000 | |
| ŌĆāProtein, g | 70.9┬▒35.1 | 58.9┬▒29.6 | 0.000 | |
| ŌĆāLipid, g | 38.28┬▒28.6 | 30.67┬▒25.2 | 0.000 | |
| ŌĆāCarbohydrate, g | 320.3┬▒120.1 | 315.1┬▒125.9 | 0.535 | |
| Physical activity | ||||
| ŌĆāActivity limitation | 43 (8.2) | 58 (12.6) | 0.064 | |
| ŌĆāVigorous activity in the workplace | 11 (2.1) | 9 (2.0) | 0.971 | |
| ŌĆāVigorous activity for leisure | 54 (10.3) | 26 (5.7) | 0.030 | |
| Cough over 3 months* | 32 (6.1) | 29 (6.3) | 0.885 | |
| Sputum over 3 monthsŌĆĀ | 75 (14.3) | 60 (13.1) | 0.581 | |
| Weight loss for a year | 59 (11.2) | 69 (15.0) | 0.151 | |
* Participants had to respond to the following question: ŌĆ£Have you had a cough on most days for 3 months or more during the past year?ŌĆØ.
ŌĆĀ Participants had a response to the following question: ŌĆ£Have you had sputum almost every day for at least 3 consecutive months 1 year?ŌĆØ
BMI: body mass index; PFT: pulmonary function test; FEV1: forced expiratory volume per 1 second; FVC: forced vital capacity; FEV1/FVC: forced expiratory volume per 1 second/forced vital capacity; CRF: chronic renal failure; LC: liver cirrhosis; TB: tuberculosis; AST: aspartate transaminase; ALT: alanine transferase; BUN: blood urea nitrogen.
Table┬Ā2.
|
Alcohol drinkers (n=525) |
Non-alcohol drinkers (n=459) | p-value | ||
|---|---|---|---|---|
| Light to moderate-risk (n=318) | High-risk (n=207) | |||
| EQ-5D index (n=954) | 0.94┬▒0.11 | 0.91┬▒0.13* | 0.002 | |
| 0.94┬▒0.1 | 0.93┬▒0.12* | 0.342 | ||
| PHQ-9 score (n=940) | 2.15┬▒3.57 | 2.78┬▒4.14ŌĆĀ,ŌĆĪ | 0.014 | |
| 1.83┬▒3.08ŌĆĀ | 2.64┬▒4.19ŌĆĪ | 0.01 | ||
Table┬Ā3.
| Variable |
Quality of life (EQ-5D index) |
Depressive mood (PHQ-9 score) |
||
|---|---|---|---|---|
| ╬▓┬▒SE | p-value | ╬▓┬▒SE | p-value | |
| Age, yr | -0.003┬▒0.001 | 0.000 | 0.025┬▒0.026 | 0.342 |
| Male sex | -0.057┬▒0.018 | 0.001 | 1.356┬▒0.605 | 0.026 |
| BMI, kg/m2 | 0.000┬▒0.002 | 0.886 | -0.197┬▒0.078 | 0.012 |
| FEV1, % predicted | 0.000┬▒0.001 | 0.693 | 0.018┬▒0.031 | 0.573 |
| Current smoking | -0.041┬▒0.016 | 0.012 | 0.878┬▒0.561 | 0.119 |
| Alcohol drinking | 0.016┬▒0.014 | 0.282 | 0.351┬▒0.497 | 0.480 |
| Level of education, >12 years* | 0.000┬▒0.001 | 0.693 | -0.012┬▒0.040 | 0.775 |
| Activity limitation by any cause | 0.148┬▒0.019 | 0.000 | -3.979┬▒0.656 | 0.000 |
| Metabolic syndrome | -0.022┬▒0.018 | 0.206 | 0.228┬▒0.604 | 0.706 |
| Weight change for a yearŌĆĀ | -0.005┬▒0.010 | 0.602 | 0.301┬▒0.343 | 0.381 |
| Cough over 3 months | -0.07┬▒0.03 | 0.852 | 0.009┬▒1.043 | 0.993 |
| Sputum for 3 months | -0.004┬▒0.023 | 0.021 | 1.821┬▒0.788 | 0.022 |
| Calories intake per day | -0.0002┬▒0.000 | 0.036 | 0.000┬▒0.000 | 0.124 |
* Weight change was defined by the following question: ŌĆ£Have there been any changes in your weight during the last year? If so, how much weight did you lose or gain?ŌĆØ Answers were categorized as ŌĆ£No change,ŌĆØ weight loss of 3-6 or Ōēź6 kg, or weight gain of 3-6 or Ōēź6 kg.
Table┬Ā4.
References
- TOOLS
-
METRICS

- ORCID iDs
-
I Re Heo

https://orcid.org/0000-0002-5832-5233Ho Cheol Kim

https://orcid.org/0000-0002-3262-0672 - Related articles


 PDF Links
 PubReader
 ePub Link
 Data Sharing Statement
 Full text via DOI
 Print
Print Download Citation


