Tuberculosis in Mexico and the USA, Comparison of Trends Over Time 1990-2010
Article information
Abstract
Background
The aim was to compare tuberculosis trends in Mexico and United States and to evaluate Mexican diagnostic methods and contact investigation.
Methods
Retrospective comparative study of tuberculosis cases and incidence rates between both countries (1990-2010). Diagnostic methods and contact investigations were also evaluated for Mexico. Estimates were obtained from official websites.
Results
In Mexico, no clear trend was found over time for cases. Pulmonary (PTB) and all forms of tuberculosis (AFTB) incidence decreased 2.0% annually. There was a negative correlation between the mean contacts examined per case and AFTB incidence (r2=-0.44, p=0.01) with a 33% reduction in AFTB incidence. In United States, PTB and AFTB cases have been decreasing 6.0% and 5.6% annually, respectively. The incidence decreased 7.3% and 6.8%, respectively.
Conclusion
The incidence of tuberculosis in Mexico is decreasing slightly over time at 2% annually. In the United States, cases and incidence rates have been decreasing at a higher rate (5% to 7% annually). The inverse association between number of contacts examined per state and incidence rates in Mexico underscore the importance of reinforcing and improving contact investigations with the likely translation of a decrease of TB incidence at a higher rate.
Introduction
The World Health Organization has estimated that 9.0 million people developed tuberculosis (TB) in 2013 worldwide and approximately one third of the world's population has latent TB infection (LTBI)1. Preventive treatment is recommended for those with LTBI as about 5% to 10% of them will develop TB disease (reactivation) at some point in life with the highest risk within the five years of LTBI acquisition234.
It has been estimated that TB reactivation may be the cause of up to 70% of TB incident cases5 hence, prevention of reactivation, particularly in the population at the highest risk of active TB, i.e., close and household contacts with LTBI-mainly children <5 years represents one of the main interventions for TB elimination which is defined as <1 case per million population per year.
Thousands of patients are diagnosed with TB in Mexico every year and it continues to be a public health concern so it is important to review trends of the number of cases and the incidence rates. Comparing the trend with that of the neighbouring country, The United States, is important as the majority of the 21% to 23% of foreign born TB cases in the United States are Mexican6.
The primary objective of this study was to compare trends of the number of TB cases and the annual incidence rates (pulmonary and all forms) in Mexico and the United States from 1990 to 2010.
Estimates of the preventive program (namely contact investigations and preventive treatment) of the current diagnostic methods by state and/or the whole country were available in official reports published online for Mexico but not for the United States. Therefore, the secondary objective of this study was to assess and to determine gaps in the TB Mexican prevention program that might be influencing the lack of TB control.
Materials and Methods
The annual number of TB cases (pulmonary and all forms), incidence rates (per 100,000 population per year), diagnostic method and number of contacts examined per TB case in Mexico were obtained from online reports published by the Dirección General de Epidemiología (Anuarios de Morbilidad)7 under the Mexican Ministry of Health. Information on number of cases and incidence rates in this study included the period from 1990 to 2010.
Estimates, by state and/or the whole country, of the number of contacts per case, of the percentage of contacts that received preventive treatment from 2007 to 2010 and diagnostic methods for 2010 were available online for Mexico8. Definitions for cases and contacts for Mexico were based on Mexican guidelines published online at the time of this study9.
Confirmed and non-confirmed cases include respectively, cases culture positive for M. tuberculosis and clinical cases. Contact is defined as a person who resides, has resided or associates with a baciliferous TB case, this include household and non-household contacts9. The official document listing estimates for contacts in Mexico8 does not explain the meaning of "contacts examined." The word "examined" is not defined in the current Mexican guidelines9.
For the purpose of this study, it was assumed that "contacts examined" refers to those undergoing contact investigation understood as the process of identifying, examining, evaluating, and treating all persons who are at risk for infection with M. tuberculosis due to recent exposure to a newly diagnosed or suspected case of pulmonary, laryngeal, or pleural TB10.
Annual number of TB cases and incidence rates in the United States from 1990 to 2010 were obtained from online official reports111213. Number of cases and incidence rates were plotted to visually assess temporal changes.
Generalized linear models (GLMs) with binomial distribution and log-link function were constructed to assess for changes over the entire study period. The exact Wilcoxon two-sample test was used to assess for differences in the mean number of contacts per case and incidence rates in Mexico. A p-value of <0.05 was considered statistically significant.
Statistical analysis was performed by using SAS (SAS Institute Inc., Cary, NC, USA). The study received ethics approval by the local Institutional Review Board.
Results
Compared to Mexican estimates, assessing changes over time shows a clear reduction in the number of cases and incidence rates in the United States (Table 1, Figure 1). The absolute percent change from 1990 to 2010 (APC-1990-2010) of the number of pulmonary TB cases (PTB) in Mexico increased 25.7% (12,242 cases in 1990 to 15,384 in 2010) with an annual mean increase of 1.5%; however, the change over time was not statistically significant (parameter estimated by GLM -0.0076, p=0.09).

Number of TB cases and incidence rates per 100,000 population in Mexico and the United States, 1990-2010
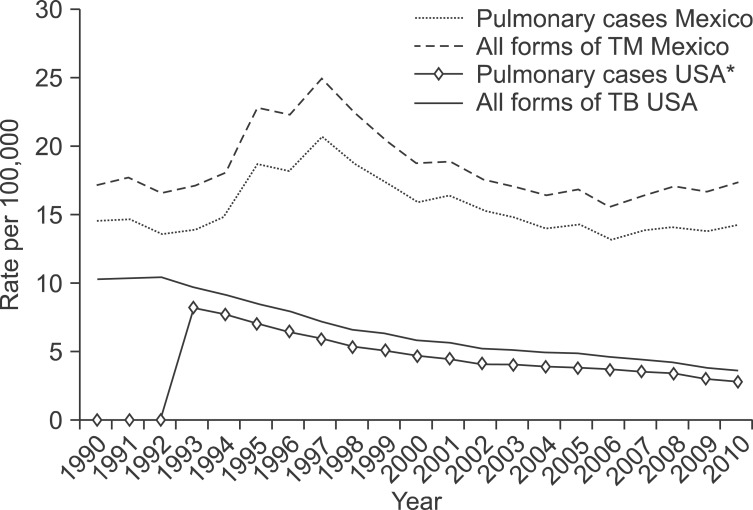
Incidence rates of pulmonary and all forms of tuberculosis (TB) in Mexico and the United States, 1990-2010. *Pulmonary cases for the United States were not available from 1990 to 1992.
The incidence of PTB was 14.6 in 1990 and 14.2 in 2010 (APC-1990-2010 of -2.7%, annual mean of 0.2%) with a decrease over time of 2% per year (GLM, -0.0197; p=0.03). The APC-1990-2010 of all forms of TB (AFTB) cases in Mexico was 30.6% (annual mean of 1.7%) with 14,437 cases in 1990 and 18,848 in 2010 but the change over time did not reach the statistical significance level (GLM, -0.0082; p=0.06). The incidence of AFTB in Mexico was 17.2 in 1990 and 17.4 in 2010 (APC-1990-2010 of 1.2%, annual mean of 0.4%) and the trend indicated a 2% annual decrease over time (GLM, -0.0206; p=0.01) (Table 1).
In 2010, the highest incidence rates in Mexico were reported at border states with the United States8. Baja California had 52.5 cases per 100,000, Sonora 32.9, Chihuahua 20.7, Coahuila 26.5, Nuevo Leon 25 and Tamaulipas with 36.4, Baja California Sur 24.9 (Table 2). The mean AFTB incidence from 2007 to 2010 of border Mexican states was about two-fold compared to all other states 30.4 (SD, 9.6; range, 21.2-49.5) versus 15.4 (SD, 8.7; range, 3.9-35.1) respectively (exact Wilcoxon two-sample test, p<0.01) (data not shown).
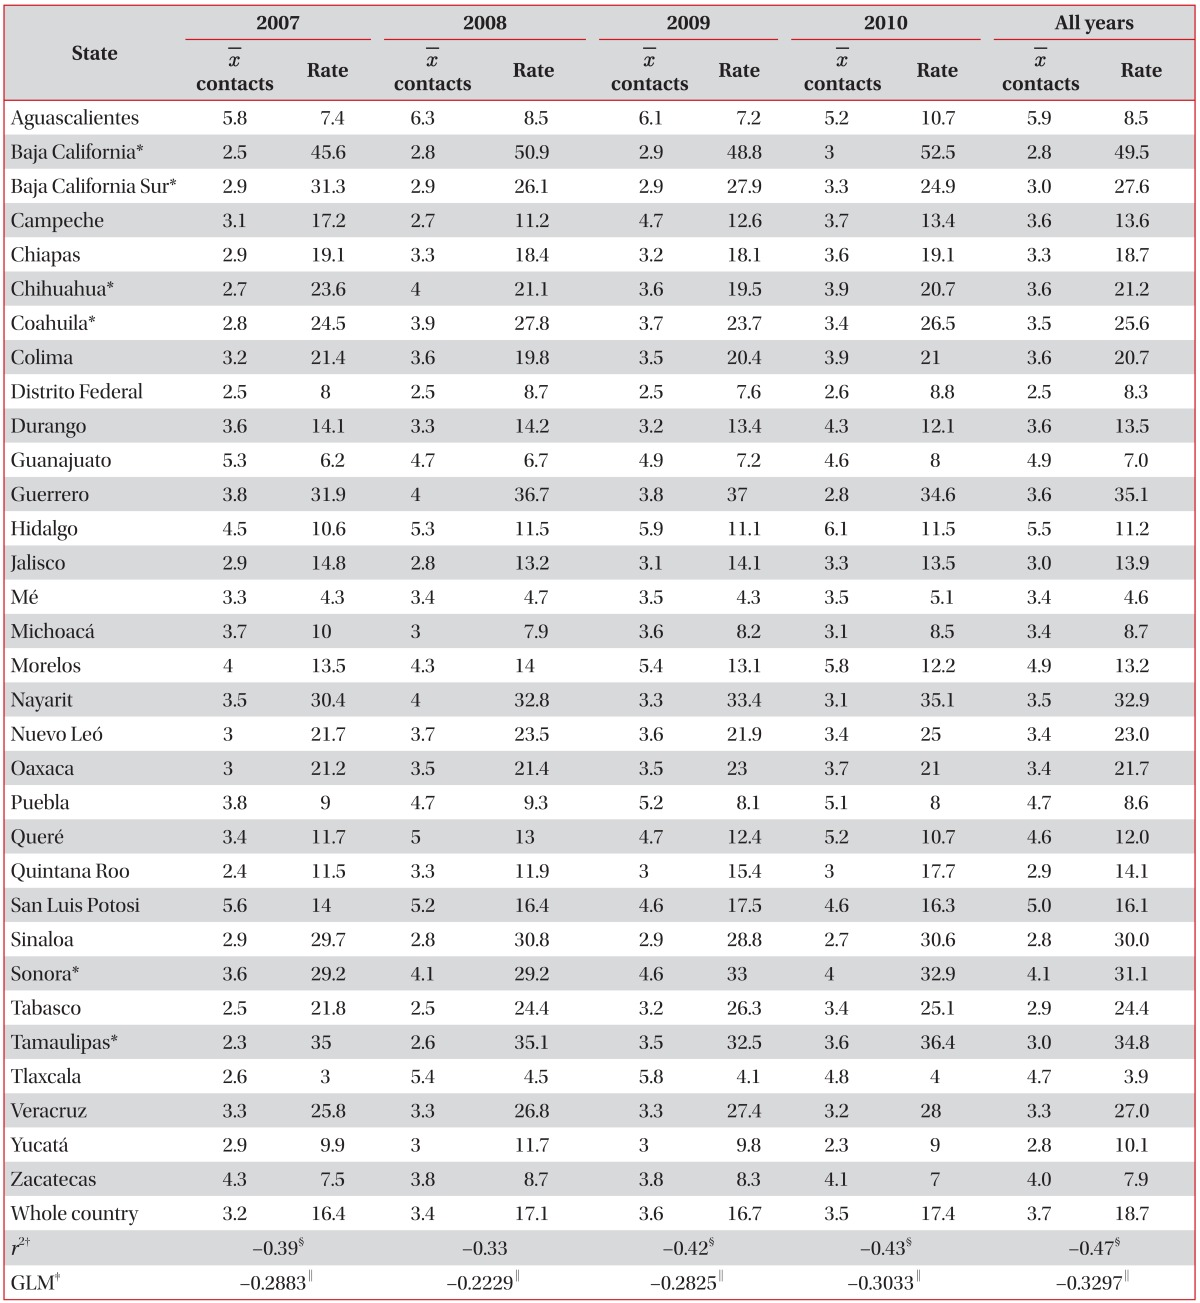
Average number of contacts examined per case of tuberculosis and incidence rates per 100,000 by Mexican State, 2007-2010
Of all contacts listed in Mexico, 82.8%, 87.2%, 88.5%, and 87% were examined in years 2007, 2008, 2009, and 2010, respectively8. The average number of contacts examined per case and the incidence rates by state from 2007 to 2010 are shown in Table 2. The most recent report in 2010 showed that 87% of 76,416 contacts listed by patients were examined with an average of 3.5 contacts examined per case. The analysis by Mexican state showed a negative correlation between the mean number of contacts examined and the AFTB incidence, Pearson's correlation coefficient of -0.39 (p=0.02), 0.34 (p=0.058), -0.42 (p=0.01), and -0.43 (p=0.01) for years of 2007, 2008, 2009, and 2010, respectively (Table 2). For each unit increase in the mean number of contacts examined there was a 22% to 30% reduction in the AFTB incidence in Mexico during this period.
The mean values of these two indicators for all four years confirmed a negative correlation (r2=-0.47, p=0.01) with a 33% reduction in AFTB incidence for each unit increase in the mean number of contacts examined (see GLM estimates on Table 2). There was no difference in the mean number of contacts examined between and all other states (3.3 vs. 3.8, respectively; p=0.18), data not shown. Of total contacts (all ages) of cases with PTB, 43.4%, 52.4%, 51.5%, and 43.3% received preventive treatment in years 2007, 2008, 2009, and 2010 respectively. The distribution by age group showed that 45.5%, 76.5%, 81.6%, and 66.7% of contacts <5 years of age received preventive treatment respectively in those years8.
Regarding diagnostic methods in Mexico in 2010, 75.4% of cases with AFTB were diagnosed by positive acid-fast bacilli (AFB) smear, 1.3% by culture and the remaining 23.2% by other means including radiological, histopathological, clinical, epidemiologically, clinical-epidemiological or by other non-specified means8. Except for the state of New Mexico, the highest TB incidence rates in the United States in 2010 were reported in the border states with Mexico with most states reporting >3.6 cases per 100,000 which was the national average in 201013.
In the United States, the APC (data not available for PTB in the United States from 1990 to 1992, see Contact Investigation10) of PTB cases was -58.8% (annual mean of -5.0) with 21,158 cases in 1993 and 8,709 in 2010, the analysis over time showed an annual reduction of 6.0% (GLM, -0.0607; p<0.0001) (Table 1). The APC of PTB incidence rate in the United States was -63.7% (annual mean of -6.1) and a decrease over time of 7.3% annually (GLM, -0.073; p<0.001).
The APC-1990-2010 of AFTB cases in the United States was -56.5% (annual mean of -4.0) with 25,701 cases in 1990 and 11,182 in 2010) the trend analysis showed 5.6% annual reduction in AFTB cases (GLM, -0.056; p≤0.0001). The APC-1990-2010 of AFTB incidence was -65% (annual mean of -5.1%) with 10.3 per 100,000 in 1990 to 3.6 in 2010. AFTB incidence has been decreasing over time at 6.8% annually (GLM, -0.068; p≤0.0001) (Table 1).
Discussion
In this study, we found that the number of PTB and all forms of TB cases in Mexico increased in the last two decades but the analysis did not reach a statistically significant trend over time. PTB and AFTB incidence rates decreased only at 2% annually. According to the Millennium Development Goals (MDG) in Mexico14, authorities set the objective to decrease AFTB incidence with a target for an incidence of 15.6 per 100,000 by 2015.
At the 2% decrease in rate, an incidence of 15.7 per 100,000 is expected by 2015 which will be close to the Mexican MDG target, however, according to the World Health Organization's MDG, the prevalence and death rates of TB should be reduced by 50% compared to their levels in 1990 by 2015. The incidence of TB in Mexico in 2010 was similar to the incidence in 1990 indicating that the World Health Organization target is unlikely to be met by 2015.
In 1989, US authorities initiated a strategic plan for the elimination of TB in the USA by 201015. Even though this objective was not met (36 cases per million or 3.6 per 100,000 in 2010), the number of cases and incidence rates for pulmonary and all forms of TB in the United States have been gradually decreasing over time and at a higher rate (5.6% to 7.3% annually) than Mexico. The highest rate of decrease was seen in the incidence of PTB (7.3% annually).
Although in the last Mexican report8 it is assumed that "contacts examined"means contact investigation (investigación de contactos in Spanish), it is not clearly and specifically defined in this report nor in the current TB Mexican guidelines9 i.e., it is not mentioned whether "contacts examined" were examined by a physician looking for signs of active TB, whether contacts had a tuberculin skin test (TST) or QuantiFERON done, had a chest X-ray or whether preventive treatment was offered and/or received.
According to the recent report8 between 43.3% and 52.4% of contacts received chemoprophylaxis. However, the total number of contacts in this analysis does not match the total number of "contacts examined" elsewhere in that report8. Clarification of terms is needed in future reports to assist in reporting and detect screening and treatment gaps.
Our results indicate that increasing the number of contacts examined per case (and therefore the number of contacts treated for LTBI) will reduce the incidence of TB in Mexico as indicated by the negative correlation between both indicators by Mexican State in the last four years (2007-2010). On average, a 33% reduction in AFTB incidence is expected for each unit increase in the mean number of contacts "examined."
The priority would be the implementation of a program specifically focused on contacts at the highest risk of acquiring LTBI or disease i.e. household and close contacts exposed to AFB positive patients with PTB. Improving contact investigations in Mexico will likely translate in a decrease in TB incidence not only in Mexico but also in US border states.
Most TB cases in Mexico were diagnosed by AFB smear only. The recent report including the period 2000 to 2007 showed that in some locations like Mexico City, the number of TB cultures have increased but in most states there has been no clear increase in the number of cultures performed and actually the total in the whole country was higher in 2000 with 12,443 cultures compared with 11,347 in 20078. Current Mexican guidelines916 require that any patient with a positive AFB be considered a confirmed case of TB with or without culture because it would be more risky not to initiate TB treatment even if the culture later yields nontuberculous mycobacteria (NTM). Relying on AFB smear as the only method of diagnosis may include cases of NTM disease or drug-resistant TB with the initiation of the wrong treatment1718. Therefore, physicians should be aware of the limitation in diagnosing TB diseases based only on AFB positivity particularly when there is lack of clinical response to treatment.
Follow-up investigation for contacts of patients considered as having TB disease based on a positive AFB only but actually infected with nontuberculous disease results in wasted resources. Research studies in Mexico are needed to establish the prevalence of NTM in AFB positive patients initially diagnosed as TB pulmonary cases. A previous study searching for mycobacterium species in extrapulmonary specimens showed that NTM were found in a considerable number of patients19.
It is therefore important to have access to new, fast and affordable diagnostic tests such as polymerase chain reaction-based Xpert MTB/RIF which has already been implemented in some Mexican states even though their impact has not been reported. In the states with the highest incidence of TB it would be a priority to implement these novel diagnostic tests. Having a timely and appropriate diagnosis particularly in high risk groups (i.e., patients with malnutrition, human immunodeficiency virus, diabetes, etc.) and establishing the appropriate treatment with high completion rates, will help reduce transmission and disease incidence.
Even though estimates of the preventive program indicators were not available by state of the whole country, the US TB program has illustrated the importance not only to timely and accurate diagnosis and appropriate treatment of active cases but also to screening and treatment of cases with LTBI particularly the foreign born because with 60% of cases they represent the main disease burden. Foreign born, 2 years of age or older entering the US are required to be screened with the TST and those deemed to have LTBI receive preventive treatment. The effectiveness of the preventive treatment has been evident in a recent study from Tennessee20.
The efficacy of such programs contributed to the progressive decrease in TB incidence in the United States. Any failure in progress toward the TB elimination goal was due to lack of fully implementing a number of key components of the plan21. Areas for potential improvement in the US TB program include reducing the testing of low-risk persons, use of interferon-γ release assaytesting which is the ideal test in bacillus Calmette-Guérin (BCG)-vaccinated individuals particularly Mexicans as BCG-vaccination is universal and usually given in the first days of life. Other important areas within the program include achieving higher rates of treatment completion, possibly with short-course regimens. Targeted testing and treatment of LTBI has been identified as the key preventive intervention in the foreign born, the high-risk population in the United States. Other actions towards TB elimination include encouragement of health care workers from public and private sectors in reporting results of assessment of those at risk of TB by using effective and efficient information systems that allow routine assessment of progress followed by appropriate testing for the identification of people with LTBI and termination of preventive treatment21.
In New York City, funding has been used to improve laboratory diagnosis, ensure adherence to and completion of appropriate treatment regimens, improve infection control in hospitals, jails, and homeless shelters and provide treatment for TB22.
In this study, the aim is to encourage effective action aimed at reducing TB transmission and prevention of disease: timely, accurate diagnosis and treatment of infectious AFB positive cases ideally with directly observed treatment DOT with the practice of infection control, active contact tracing to find and treat new active cases and/or contacts with LTBI and detection and treatment of LTBI in other high risk groups. These actions should be reinforced/implemented especially on both sides of the US-Mexican border as border states report the highest TB incidence rates. In addition to this, all national TB programs also require political commitment, a well-organized and collaborative prevention program, intensified case-finding, coordinated treatment and strengthened surveillance.
Notes
Conflicts of Interest: No potential conflict of interest relevant to this article was reported.