Chest Radiography of Tuberculosis: Determination of Activity Using Deep Learning Algorithm
Article information
Abstract
Background
Inactive or old, healed tuberculosis (TB) on chest radiograph (CR) is often found in high TB incidence countries, and to avoid unnecessary evaluation and medication, differentiation from active TB is important. This study develops a deep learning (DL) model to estimate activity in a single chest radiographic analysis.
Methods
A total of 3,824 active TB CRs from 511 individuals and 2,277 inactive TB CRs from 558 individuals were retrospectively collected. A pretrained convolutional neural network was fine-tuned to classify active and inactive TB. The model was pretrained with 8,964 pneumonia and 8,525 normal cases from the National Institute of Health (NIH) dataset. During the pretraining phase, the DL model learns the following tasks: pneumonia vs. normal, pneumonia vs. active TB, and active TB vs. normal. The performance of the DL model was validated using three external datasets. Receiver operating characteristic analyses were performed to evaluate the diagnostic performance to determine active TB by DL model and radiologists. Sensitivities and specificities for determining active TB were evaluated for both the DL model and radiologists.
Results
The performance of the DL model showed area under the curve (AUC) values of 0.980 in internal validation, and 0.815 and 0.887 in external validation. The AUC values for the DL model, thoracic radiologist, and general radiologist, evaluated using one of the external validation datasets, were 0.815, 0.871, and 0.811, respectively.
Conclusion
This DL-based algorithm showed potential as an effective diagnostic tool to identify TB activity, and could be useful for the follow-up of patients with inactive TB in high TB burden countries.
Introduction
Tuberculosis (TB) is a major public health problem in South Korea. Among the member countries of the Organisation for Economic Co-operation and Development, Korea has the highest incidence rate of TB at 59 cases per 100,000 population, as well as the second-highest TB mortality rate at four deaths per 100,000 population [1]. In high TB burden countries, there are many cases of spontaneously healed or inactive TB in the population. Although direct data on the current prevalence of inactive TB are not available, up to 13.8%–23.2% have been reported in the literature [2,3]. Inactive or old, healed TB is often found in chest radiographs (CRs), and is generally defined as radiologically dense nodules, and fibrosis-like linear opacities with or without traction bronchiectasis in the upper lobes. In areas with high TB burden, most inactive or old, healed TB lesions do not require further examination, only regular follow-up. However, inactive TB should be distinguished from normal, because there is a risk of reactivation, and according to the guidelines, treatment for latent tuberculosis infection (LTBI) may be required [4].
There have been many proposals for an automated method to detect TB as a mass detection tool to screen large populations [5-9]. In addition, recent advances in deep learning (DL) techniques have led to research on detection methods using convolutional neural networks (CNN) [10-12]. Lakhani and Sundaram [11] evaluated the efficacy of deep CNN for detecting TB on CRs, and reported an area under the receiver operating characteristic curve (AUROC) of 0.99. Hwang et al. [12]’s deep learning based automatic detection (DLAD) algorithm showed classification performance of 0.977–1.000 and localization performance of 0.973–1.000. The algorithm exhibited significantly higher performance in both classification (0.993 vs. 0.746–0.971) and localization (0.993 vs. 0.664–0.925) compared to all groups of physicians [12].
Recently, Lee et al. [13] published a study of DL to determine TB activity in chest radiography. Their study focused on scoring disease activities using pre- and post-treatment chest radiographies of TB, correlating them with smear test results, and comparing the performance with human readers. Although our study has a similar subject to theirs, we set out to develop a DL model to compare with human predictions for TB, for which activity is difficult to determine from images alone, and for the follow-up of inactive TB patients.
Materials and Methods
The study was approved by the Institutional Review Board of Boramae Medical Center (IRB No. 10-2017-32), and was performed in accordance with the principles of the Declaration of Helsinki. For this retrospective study, the Institutional Review Board approval was granted from all participating institutions, and the requirement for informed consent was waived.
1. Datasets
Active TB CRs were collected from patients who were diagnosed with active pulmonary TB by microbiologic exam or polymerase chain reaction for Mycobacterium tuberculosis between 2007 and 2018, and who also had computed tomography (CT) showing findings that were consistent with active pulmonary TB, including centrilobular nodules, consolidation, and cavitation. In these patients, consecutive CRs were collected for a period of less than 3 months from the date of diagnosis; but when there was CT showing the persistent activity of TB, corresponding CRs were additionally collected. Inactive TB CRs were collected from individuals who underwent chest radiography for routine screening between 2006 and 2018, and were defined as typical findings of fibronodular opacities in both upper lung zones, and with no change for more than 6 months. CRs with only calcified nodules or linear opacities were also included in the inactive TB data. All CR images from both active and inactive TB patient groups that met the criteria described above were reviewed and labeled by board-certified radiologists. Finally, to develop the DL-based algorithm, a total of 3,824 active TB CRs from 511 individuals and 2,277 inactive TB CRs from 558 individuals were retrospectively collected.
All CRs were deidentified according to the Health Insurance Portability and Accountability Act Safe Harbor standard. Thereafter, CR data were randomly assigned into three datasets: a training dataset of 3,100 active TB CRs and 1,500 inactive TB CRs to fit the parameters; a validation dataset of 624 active TB CRs and 677 inactive TB CRs to tune the model’s hyperparameters; and a testing dataset of 100 active TB CRs and 100 inactive TB CRs to assess the performance. The patients in each dataset were exclusive from the other two datasets.
2. Development of the algorithm
The DL model was based on the ResNet50 pretrained on the ImageNet dataset. We performed pretraining using 8,964 pneumonia and 8,525 normal cases from the National Institute of Health (NIH) Chest X-ray dataset. The model has three pretrain phases: pneumonia vs. normal, pneumonia vs. active TB, and active TB vs. normal. The 3,100 active TB cases were taken from our training dataset. After sub-tasks with pretraining, a model was trained to solve the target task: active TB vs. inactive TB (Figure 1). Image augmentations, including random blur, random crop, and random rotation and histogram normalization, were also used.
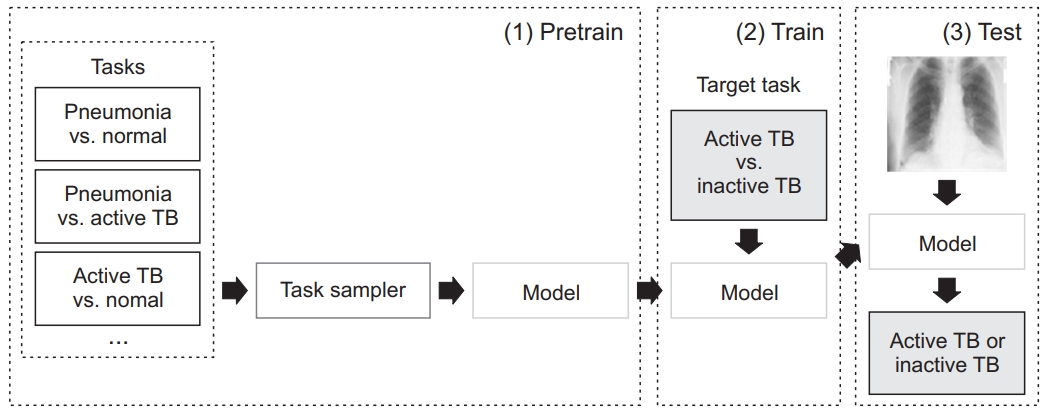
Pretraining approach. TB: tuberculosis.
3. Assessment of DL model performance
In addition to the performance assessment using an internal validation dataset, external validation datasets from three institutions (Seoul National University Hospital [SNUH], Seoul National University Bundang Hospital [SNUBH], and Chungbuk National University Hospital [CNUH]) were retrospectively collected to investigate the generalization performance of this DL model. The inclusion criteria of the three external validation datasets were applied in the same way as the dataset criteria used for DL model development. Table 1 provides detailed demographic descriptions of the datasets.
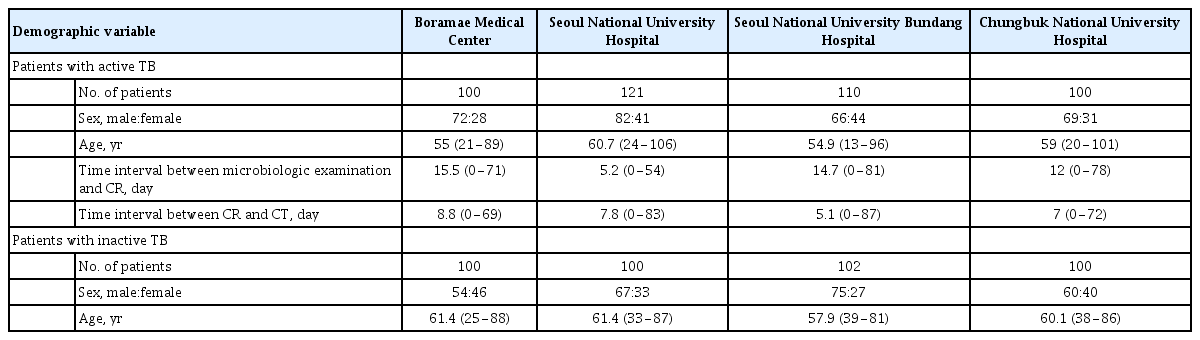
Demographic description of the datasets
4. Radiologists’ performance test
To assess the radiologists’ performance, Viewer for Digital Evaluation of X-ray Images (ViewDEX 2.0) was used for the tests. A thoracic radiologist and a general radiologist performed the test to determine active TB and inactive TB on a 5-point confidence scale: 1: very confident, case is inactive; 2: confident, case is inactive; 3: somewhat confident, case is active; 4: confident, case is active; and 5: very confident, case is active.
5. Statistical analysis
Receiver operating characteristic (ROC) analyses were performed to evaluate the diagnostic performance to determine active TB by the DL model, and by radiologists. For ROC analysis of the DL model, the prediction and probability value of each CR were considered to be the confidence level. Sensitivities and specificities to determine active TB were evaluated in both the DL model and radiologists. All statistical analyses were performed using MedCalc software version 19.3.1 (MedCalc, Ostend, Belgium).
Results
1. Validation and assessment of diagnostic performance
Using the internal validation dataset, we validated this DL model, and compared the result from the model with or without meta-training. The sensitivity and specificity of the determination of active TB in the DL model without meta-training were 93% and 92%, respectively. The sensitivity and specificity increased to 99% and 95%, respectively, in the DL model with pretraining.
In the internal validation dataset, the area under the curve (AUC) of the DL model was 0.980 (95% confidence interval [CI], 0.950 to 0.994; p<0.001). Using the external validation datasets, in the SNUH, SNUBH, and CNUH datasets, the sensitivities were 85.1%, 99.1%, and 100%, and the specificities were 65.0%, 60.8%, and 59.0%, respectively, while the AUC values were 0.815 (95% CI, 0.757 to 0.864; p<0.001), 0.887 (95% CI, 0.837 to 0.927; p<0.001), and 0.887 (95% CI, 0.834 to 0.927; p<0.001), respectively. Table 2 shows the performance of the DL model for the internal and external validation datasets.

Diagnostic performance of the deep learning model
2. Observer performance test
Using the internal validation dataset, the sensitivity and specificity of the thoracic radiologist was 98% and 93%, respectively, and the AUC was 0.985 (95% CI, 0.957 to 0.997; p<0.001). There was no significant difference between the AUC value of the DL model and the thoracic radiologist (p=0.651). Using one of the external datasets (the SNUH dataset), the AUCs in the DL model, the thoracic radiologist, and the general radiologist were 0.815 (95% CI, 0.757 to 0.864; p<0.001), 0.871 (95% CI, 0.820 to 0.913; p<0.001), and 0.811 (95% CI, 0.754 to 0.861; p<0.001), respectively. There was no significant difference between the AUC values of the DL and the thoracic radiologist (p=0.125), or between the DL model and the general radiologist (p=0.933). Table 3 and Figure 2 show the performance of the DL algorithm and the thoracic and general radiologists. Figures 3 and 4 show representative images from the observer performance test.

Comparison of diagnostic performance in the deep learning model and radiologists (Seoul National University Hospital dataset)
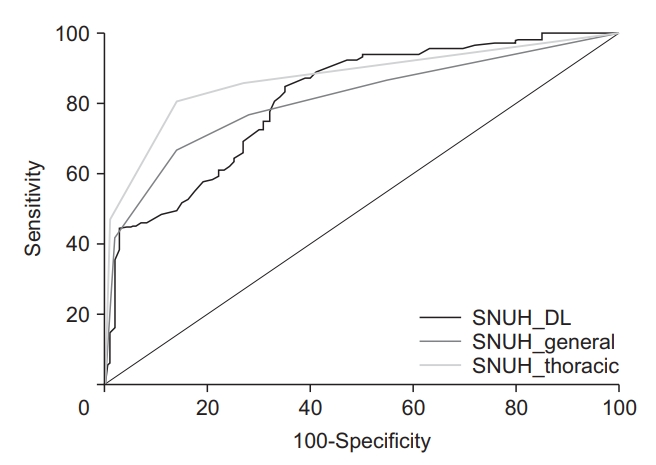
Comparison of diagnostic performance in the deep learning model and radiologists. SNUH, Seoul National University Hospital; DL: deep learning.

Representative case of active tuberculosis (TB) from the observer performance test. (A) A chest radiograph in a patient with active TB shows small nodular opacities in right upper lung zone, which was determined by a general radiologist to be active TB with confidence level 3. (B) The deep learning model also predicted active TB with a probability value of 0.71 with a corresponding classification activation map.
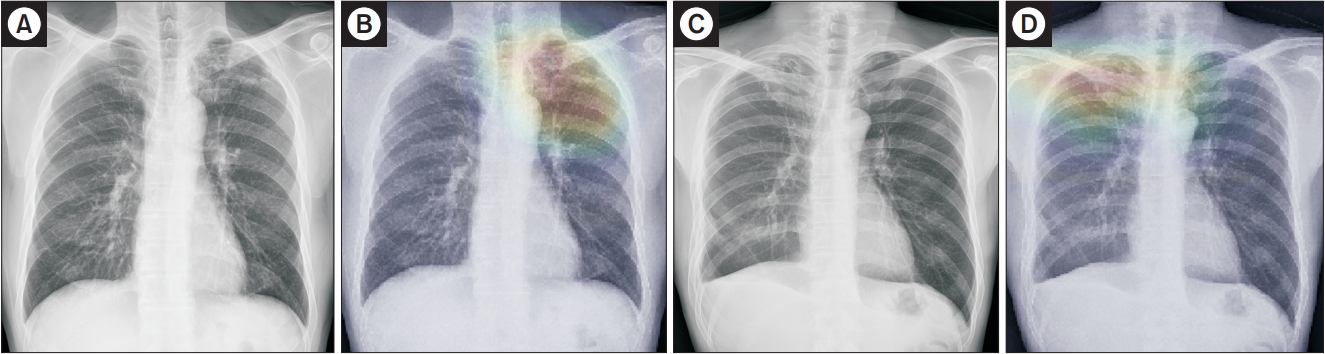
Representative cases of inactive tuberculosis (TB) from the observer performance test. (A) A chest radiograph of inactive TB showed multiple calcified nodular opacities in the left upper lung zone, which was incorrectly determined by a general radiologist to be active TB with confidence level 4. (B) However, the deep learning model predicted inactive TB with a probability score of 0.49 with a corresponding classification activation map. (C) Another chest radiograph of inactive TB showed fibronodular opacities in right lung apex, which was determined by a general radiologist to be inactive TB with confidence level 1. (D) However, the deep learning model incorrectly predicted active TB with a probability value of 0.98 with a corresponding classification activation map.
Discussion
In this study, we developed a DL-based algorithm that can determine the active TB in comparison with inactive TB in a single CR image, and the DL model showed performance similar to that of the radiologists. Most of the previous studies have been conducted to detect TB using DL algorithms, but did not consider inactive or healed TB. However, in situations where old, healed TB is often found on CRs in TB screening exams, such as in Korea, where the burden of TB is intermediate, applying their algorithm could misdiagnose inactive TB as active TB, and increase unnecessary testing or treatment. On the other hand, inactive TB lesions must also be distinguished from normal, because the association between LTBI and inactive TB in CRs has been revealed. According to a systematic review and meta-analysis for radiological signs of latent TB in CRs, abnormal findings suggestive of inactive TB—including fibrotic scar with volume loss, calcified nodules, and bronchiectasis—were significantly associated with a positive test for LTBI, although the sensitivity was low at 15% [14].
While most experienced thoracic radiologists can distinguish between active and inactive TB from a single CR, it is sometimes difficult to determine the activity by using only one radiographic image, which activity can be determined by CT or follow-up radiographs, or microbiologic exams. Therefore, developing an algorithm that can detect TB and determine activity in the first image on a screening CR would be particularly useful in the TB endemic area.
This DL model performed very well in internal validation. However, the performance was significantly lower than that in the external validation set (AUC, 0.98 vs. 0.815–0.887). This may have been affected by overfitting, but it also seems to be affected by the difficulty of the test set for each institution. While the performance of the thoracic radiologist was higher in the internal set with an AUC value of 0.985, it also decreased to 0.871 in the SNUH dataset, where the DL model showed the lowest AUC value of 0.815.
Although the difference was not statistically significant, the performance of the DL model was slightly inferior to that of the thoracic radiologist, and slightly better than that of the general radiologist (AUC, 0.815, 0.871, and 0.811 in the DL model, thoracic radiologist, and general radiologist, respectively) in the external validation. In terms of sensitivity and specificity, the DL model showed high sensitivity and low specificity in distinguishing active TB from inactive TB. Technically, this can be explained by two factors. First, in developing the DL model, the number of training data for active TB was twice the number of inactive TB data: 3,100 active TB CRs, and 1,500 inactive TB CRs. Second, the DL model was trained with pneumonia data again. As a result, it seems that the sensitivity of the algorithm for active TB increased, while the ability to discriminate inactive TB was relatively lowered. However, as inactive TB is a common radiographic finding in high TB burden countries, low specificity can be a weakness of our DL model, so it will be necessary to improve the performance of the DL model by including more inactive TB data.
Recently, Lee et al. [13] developed a DL model to determine the activity of TB using pre- and post-treatment radiographs from 3,327 patients and 3,182 normal radiographs. The model showed higher AUC (0.84) than the pulmonologists (0.71 and 0.74; p<0.001 and p<0.01, respectively), and performed similarly to the radiologists (0.79 and 0.80; p=0.08 and p=0.06, respectively) [12]. Our study differed from theirs in the data collection method. Patients with old inflammatory sequelae with no change in screening CRs were included in the negative group, while CRs of clinically proven active TB patients were retrospectively collected in the positive group. We developed a DL model to predict TB activity, and similar to their results, showed that the performance of the DL model was not inferior to that of the radiologists.
The previous study by Hwang et al. [12] used a total of 54,221 normal CRs and 6,768 TB CRs to develop the DLAD algorithm to detect active TB, where the sensitivity was 0.952, and the specificity was 1.000. In their study, the number of normal CRs in developing the DLAD algorithm was much higher, which can be interpreted to be one of the causes with very high specificity. However, the low specificity in this study reflects the real-world situation, considering that the number of inactive TB is relatively small, and often shows similar findings to active TB.
In another study that assessed the accuracy of computer-aided detection (CAD) for TB in a tertiary care setting in India [15], the CAD software showed higher sensitivity values than the radiologists (71% in CAD, 56% in radiologists). However, the specificity values were not different (80% in CAD and radiologists). Their study suggests that the specificity for TB detection in CAD software may be limited, due to the high prevalence of other lung diseases in tertiary care settings. Also, the role of CAD software as a TB screening at the primary care level may be more significant in environments with limited access to radiologists, compared to the tertiary care level.
According to a systematic review journal that evaluated CAD for pulmonary TB on digital CRs, increasing the sensitivity threshold reduced specificity [16]. Also, in the study by the Radboud group and their collaborators at the University Cape Town, South Africa, increasing the threshold score could reduce the number of suspected pulmonary TB patients undergoing confirmatory testing, but there were more cases of missed TB [17]. Therefore, when considering the costs and clinical consequences of missed TB cases, it is more reasonable that the sensitivity of the diagnostic algorithm as a screening tool is high.
In this study, we used supervised learning using labeled datasets to compare active TB and inactive TB, but did not perform lesion annotation. Even without localization of the lesion, this DL model showed relatively good performance. Perhaps because the task of distinguishing the two disease groups was relatively straightforward and distinguished by the difference in the pattern of lesions at similar locations, the DL model allowed for visual evaluation without lesion annotation.
This study has several limitations. First, the DL model is an algorithm developed only to determine TB activity, and does not consider normal or other lung diseases. Second, the data used for validation of the model are retrospectively collected active and inactive TB CRs. The selection bias from our disease-enriched and arbitrarily selected datasets makes it difficult to directly apply our study results and the DL model to the real-world setting. However, we believe that further research can be done to develop derivative algorithms that are applicable to clinical situations. In addition, based on this study conducted in an experimental environment, it is believed that future prospective studies on the development and validation of algorithms that can be applied to clinical practice will be conducted. Third, although this study is supervised learning, we did not annotate lesion localization of the DL model. Since the task of the DL model is to judge the activity of a disease, rather than the detection of a lesion, we thought that annotations were not of great importance. However, since the amount of data is not large, if more data are used for the learning effect, the accuracy can be improved.
In conclusion, the DL model performed similarly to the radiologists, and showed relatively high sensitivity and low specificity in determining active TB from the inactive TB in CR, indicating potential as an effective diagnostic tool to identify TB activity in CRs. Therefore, this DL-based algorithm could be useful for the follow-up of patients with inactive TB in countries with high TB burden.
Notes
Authors’ Contributions
Conceptualization: Choi YR, Jin KN. Methodology: Choi YR, Kim H. Formal analysis: Choi YR, Kim H. Data curation: Choi YR, Yoon SH, Kim J, Yoo JY. Software: Choi YR, Kim H. Validation: Choi YR, Yoon SH, Kim J, Yoo JY. Investigation: Choi YR, Jin KN. Writing - original draft preparation: Choi YR. Writing - review and editing: Yoon SH, Kim J, Yoo JY, Jin KN. Approval of final manuscript: all authors.
Conflicts of Interest
No potential conflict of interest relevant to this article was reported.
Funding
No funding to declare.