Clinical Features of Chronic Obstructive Pulmonary Disease with High Fractional Exhaled Nitric Oxide
Article information

Abstract
Background
The fractional exhaled nitric oxide (FENO) test is useful in asthma patients. However, a few studies on its usefulness in chronic obstructive pulmonary disease (COPD) patients have been reported. We analyzed the FENO level distribution and clinical characteristics according to the FENO level in COPD patients.
Methods
From December 2014 to June 2019, COPD patients who underwent pulmonary function and FENO tests at Chonnam National University Hospital were retrospectively evaluated for FENO, comorbidities, asthma history, blood eosinophil, and pulmonary function test. The high FENO group was defined as those with FENO level>25 parts per billion (ppb).
Results
A total of 849 COPD patients (mean age, 70.3±9.4 years) were included. The mean forced expiratory volume at 1 second was 66.5±21.7% and the mean FENO level was 24.3±20.5 ppb. Patients with FENO ≤25 ppb were 572 (67.4%) and those with FENO >25 ppb were 277 (32.6%). Blood eosinophil percentage was significantly higher (4.2±4.8 vs. 2.7±2.5, p<0.001) in patients with the high FENO group than the low FENO group. The high FENO group revealed a significantly higher frequency of patients with blood eosinophil percentage >3% (46.9% vs. 34.8%, p=0.001) and asthma history (25.6% vs. 8.6%, p<0.001) than the lower FENO group. Asthma history, blood eosinophil percentage >3%, and positive bronchodilator response (BDR) were independent risk factors for the high FENO level (adjusted odds ratio [aOR], 3.85; p<0.001; aOR, 1.46; p=0.017; and aOR, 1.57, p=0.034, respectively) in the multivariable analysis.
Conclusion
The FENO level distribution varied in COPD patients and the mean FENO value was slightly elevated. Asthma history, eosinophil percent, and positive BDR were independent risk factors for the high FENO level.
Introduction
Chronic obstructive pulmonary disease (COPD) is a globally prevalent disease with serious complications and high mortality. COPD is currently the fourth leading cause of death. Recently, its prevalence has rapidly increased and is expected to be the third leading cause of death worldwide by 2030 [1].
COPD is known to be a heterogeneous lung disease that includes many different phenotypes. Asthma can coexist with COPD, particularly in older adults, a condition known as “asthma COPD overlap (ACO) [2].” ACO is an inflammatory condition of both asthma and COPD, characterized by increased variability of airflow and incompletely reversible airway flow obstruction. ACO prevalence is estimated to be about 20% of obstructive airway disease [3]. ACO increases the disease burden because it increases acute exacerbation and hospitalization [4]. Also, it is known that ACO treatment is quite different from COPD treatment [5]; therefore, it is important to distinguish ACO from COPD. However, no clear diagnostic biomarker or criteria are available and the fraction of exhaled nitric oxide (FENO) test may help in ACO diagnosis.
Nitric oxide is produced in the epithelial cells and regulates vascular and bronchial tone in respiratory system [6]. It can be detected in exhaled gas as FENO. FENO can be easily and quickly measured with NIOX MINO (Aerocrine AB, Solna, Sweden), which is a portable hand-held and simple device providing consistent and accurate results in clinical practice [7].
The American Thoracic Society (ATS) published an evidence-based clinical practice guideline that primarily recommends the use of FENO for diagnosis and treatment of asthma, and ATS suggests no eosinophil airway inflammation in patients with FENO <25, and eosinophil airway inflammation and glucocorticoid responsiveness in patients with FENO >50 [8]. Previously, several FENO-related studies have been performed in patients with COPD and ACO. In one study including patients with COPD, the FENO measurement was not helpful in COPD typing into eosinophilic or neutrophilic subtype [9]. In recent studies, FENO measurement has been useful to distinguish between ACO from COPD [10,11]. However, the exact role of FENO in patients with established COPD remains unclear.
This study aimed to analyze the distribution of FENO levels and the clinical characteristics of high FENO in patients with COPD.
Materials and Methods
1. Patient population and study design
This study retrospectively reviewed patients over 40 years of age who underwent pulmonary function test (PFT) and FENO tests at Chonnam National University Hospital, Gwangju, Korea, from December 2014 to June 2019. Among them, patients who were likely to be COPD were selected. These participants were defined according to the Global Initiative for Chronic Obstructive Lung Disease (GOLD) criterion, which is a ratio of forced expiratory volume in 1 second (FEV1) to forced vital capacity (FVC) of <70% after bronchodilator use [2]. A total of 849 patients were enrolled. Study flow chart is shown in Figure 1. This study protocol was approved by the Institutional Review Board of Chonnam National University Hospital (IRB number: CNUH-2016-196). The requirement of informed consent was waived because of the retrospective nature of the study. All the data, including FENO, PFT, and blood eosinophil percent from participants, were estimated under stable conditions. Majority of the participants were examined on an outpatient basis. Medical information and patients’ characteristics, including age, pack-years of tobacco use, smoking status, height, weight, body mass index, medical history, including asthma and bronchiectasis, and current inhaler components, were reviewed.
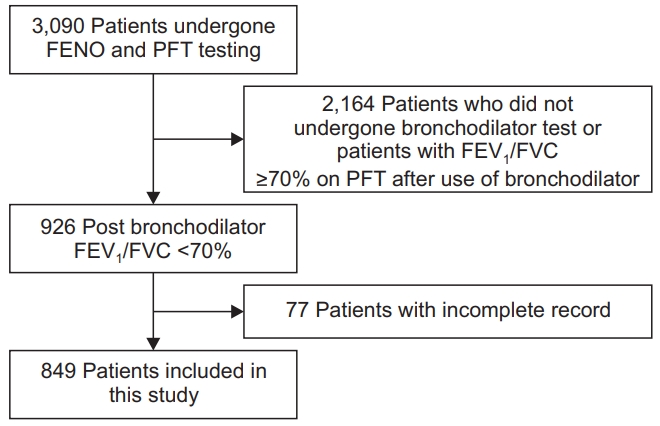
Study flow chart of patients in this study. FENO: fractional exhaled nitric oxide; PFT: pulmonary function test; FEV1: forced expiratory volume in 1 second; FVC: forced vital capacity.
2. Pulmonary function test
PFTs were performed under stable conditions. PFTs were performed according to the ATS/European Respiratory Society (ERS) guidelines [12]. Parameters collected were FVC, FEV1, percent predicted values of these parameters (% FVC, % FEV1), and FEV1/FVC ratio. All the parameters were checked after the use of bronchodilator. The severity rankings of COPD were according to the GOLD guideline [2]. A positive bronchodilator response (BDR) is defined as an increase of ≥12% and ≥200 mL as an absolute value compared with a baseline in the FEV1.
3. FENO measurements
FENO measurements were performed using a device (NIOX MINO) by a trained measurer according to the standard operating procedures recommended by the manufacturer. The FENO levels were acquired from all participants under a stable condition and expressed as parts per billion (ppb). Several cutoff values of FENO were proposed in recent studies [8,13-15]. However, there is no clear cutoff value dividing high and low FENO levels. Hence, we divided patients with COPD into two groups by referring to the ATS guideline [8] and have defined the group as “low FENO group” with FENO ≤25 and as “high FENO group” with FENO >25.
4. Statistical analyses
Means and standard deviations of quantitative variables or median and interquartile ranges were used. The relationship between blood eosinophil percent and FENO value was analyzed using Pearson’s correlation coefficients. Continuous variables were compared using the Student’s t test for those with normal distribution. The Pearson’s chi-square test was used to compare the categorical variables and the associated p-value was determined. Multivariable analysis using logistic regression model was performed to rule out the influence of each variable, which is meaningful in univariable analysis, and identify independent risk factors.
Statistical analyses were performed using SPSS version 25.0 (IBM, Armonk, NY, USA). p<0.05 indicated statistical significance.
Results
1. Prevalence
The patient characteristics in this study are summarized in Table 1. The mean value of FENO was 24.3±20.5 and median value of FENO was 19.0 (13.0–29.0). A subtotal of 692 of the 849 patients with COPD (81.5%) were males and 136 patients (16.0%) were current smokers. The mean FVC value was 3.3±1.0 L, and the mean % FVC value was slightly decreased (84.0±19.4). The mean FEV1 value was 1.8±0.7 L, and the mean % FEV1 value was significantly reduced (65.9±24.2). In the classification of FEV1 severity according to the GOLD classification, 236 (27.8%), 410 (48.3%), 178 (21.0%), and 25 (2.9%) patients corresponded to GOLD I, GOLD II, GOLD III, and GOLD IV, respectively, with highest number of patients in the GOLD II group.
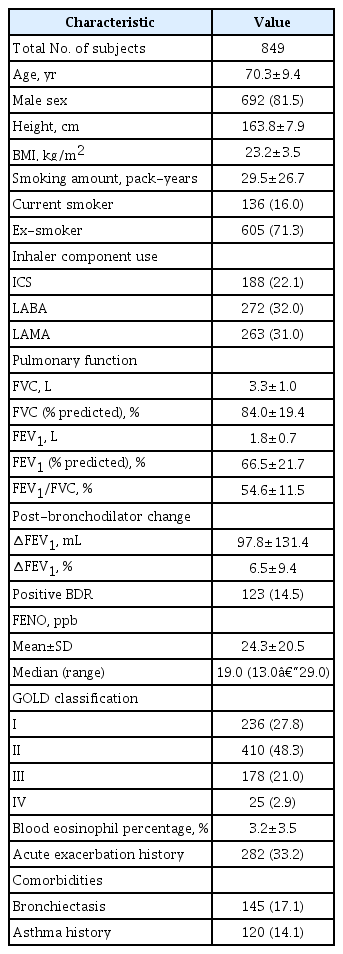
Characteristics of the subjects
Long-acting β2-agonist was the most commonly used inhaler component in 272 (32.0%) patients, long-acting muscarinic antagonist in 263 (22.5%), and inhaled corticosteroid (ICS) in 188 (22.1%). Mean eosinophil percent was 3.2±3.5 (%). Patients with COPD and bronchiectasis were 145 (17.1%), and those with asthma history were 120 (14.1%).
A histogram of the FENO levels distribution of 849 patients is shown in Figure 2A. Those with FENO ≤25 were 572 (68%) and FENO >25 were 277 (32%) (Figure 2B). FENO levels showed various distributions.
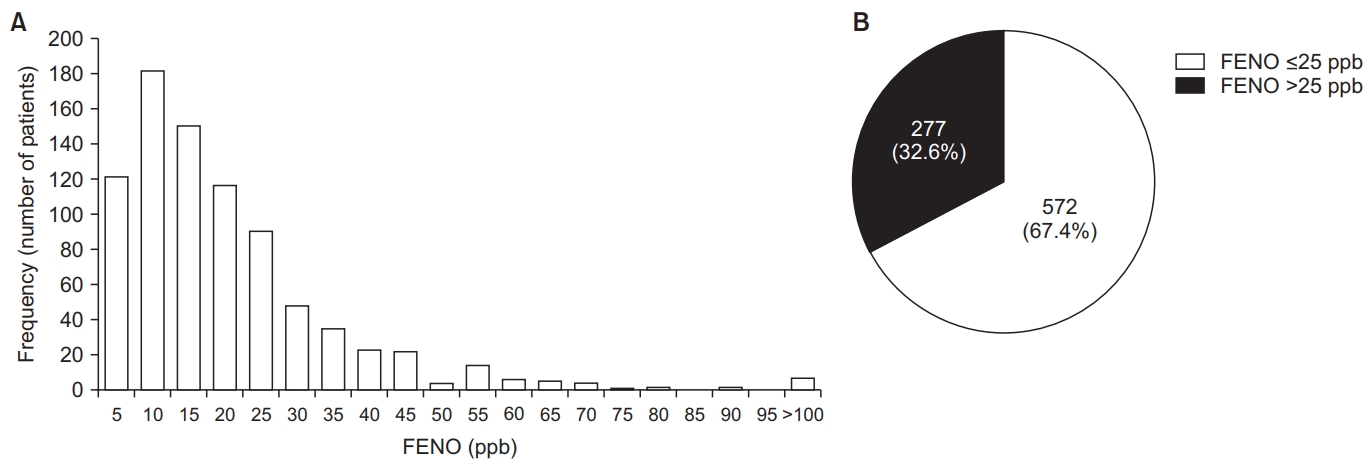
Fractional exhaled nitric oxide (FENO) levels distribution. (A) A histogram of the FENO levels distribution (n=849). (B) A pie chart; distribution divided by FENO level 25 parts per billion (ppb).
2. Correlation analysis of FENO in overall patients
Overall, the association between FENO levels and eosinophil percentage (%) was weakly positive with correlation coefficients at 0.224 (p<0.001). The results are shown in Figure 3.
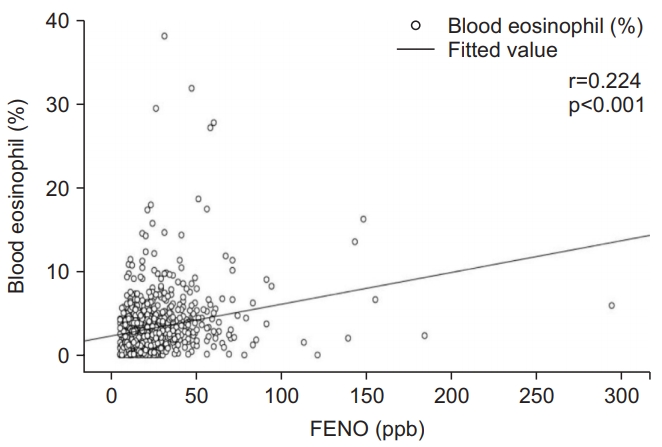
Correlation analysis of fractional exhaled nitric oxide and blood eosinophil percentage (%). FENO: fractional exhaled nitric oxide; ppb: parts per billion.
3. Comparison of low FENO group versus high FENO group
The comparison of clinical characteristics between low FENO group and high FENO group in this study is summarized in Table 2. Male sex was more frequent in the high FENO group than the low FENO group (86.6% vs. 79.0%, p=0.007). Height was slightly higher in high FENO group than low FENO group (164.8±7.6 cm vs. 163.3±8.1 cm, p=0.006). Lung function was significantly lower in low FENO group (FVC [L], FEV1 [L], 3.2±1.0 vs. 3.5±0.9, p<0.001; 1.8±0.7 vs. 1.9±0.7, p=0.001) compared with high FENO group. Positive BDR was more frequent in high FENO group than low FENO group (19.5% vs. 12.1%, p=0.004). Blood eosinophil percentage was significantly higher in high FENO group (4.2±4.8 vs. 2.7±2.5, p<0.001) than low FENO group. The frequency of patients with blood eosinophils >3% was also significantly higher in high FENO group (46.9% vs. 34.8%, p=0.001) than low FENO group. Bronchiectasis was less prevalent in the high FENO group (12.6% vs. 19.2%, p=0.017) than low FENO group. Asthma history was much prevalent in the high FENO group (25.6% vs. 8.6%, p<0.001) compared with low FENO group.
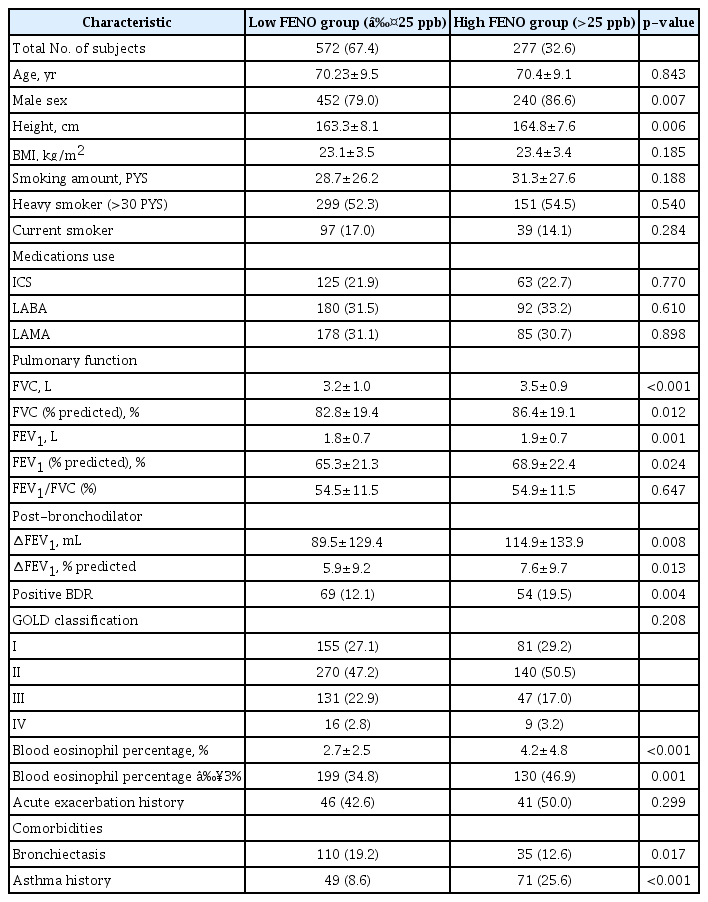
Comparison of clinical characteristics between the high and low FENO groups
Multivariable analysis was performed to find independent factors, excluding mutual interference between each factor related to high FENO level. These results are summarized in Table 3. Asthma history, blood eosinophils >3%, and positive BDR were independent risk factors for high FENO level (adjusted odds ratio [aOR], 3.85; p<0.001; aOR, 1.46; p=0.017; and aOR, 1.57; p=0.034, respectively). However, the association between high FENO and other factors (age, sex, height, lung function [FVC (L) and FEV1 (L)], and bronchiectasis) was not significant in multivariable analysis.
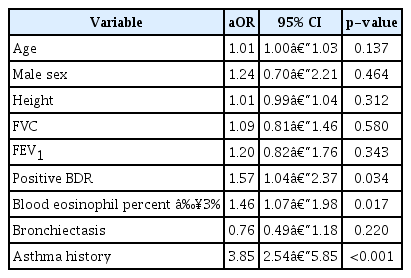
Logistic regression results for predicting increased FENO
Discussion
Two recent Korean studies have reported normal ranges of FENO levels for the adult population. Kim et al. [16] reported that mean FENO level in non-atopic males was 33.9±14.3, 37.3±12.1 in atopic males, 24.1±10.6 in non-atopic females, and 28.6±17.7 in atopic females. Jo et al. [17] reported that mean and median FENO levels in healthy populations were 14.4±9.0, 13.0 (8–19). In two previous studies conducted in Korea, there was a large difference in normal FENO level. This difference in mean FENO levels may be attributed to two reasons; firstly, various confounding factors, including measurement technique, exhalation flow rate, nasal nitric oxide contamination, the nitric oxide analyzer used, age, height, smoking status can affect FENO levels. Secondly, the somewhat smaller subjects of the previous two studies may have caused this difference. Hence, it was difficult to compare the mean FENO level from our study with these studies. However, the median FENO level (19.0 [13.0–29.0]) in our study was somewhat higher than the median level (16.0) in the ATS/ERS guidelines [8] or that of the report of Jo et al. (median, 13.0) [17]. These results are consistent with the previous findings that the FENO values of COPD patients were normal or mild elevated [18,19].
ACO prevalence is known to be approximately 20%–33% in patients with COPD [20-22]. In our study, the percent of patients in the high FENO group was approximately 32%. If we considered the high FENO group as the ACO, the proportion of high FENO group was similar to the ACO prevalence among the commonly known obstructive airway diseases. In a recent study, a FENO level ≥25.0 combined with a blood eosinophil count ≥250 cells/µL showed high specificity (96.1%) for differentiating ACO from COPD [15]. However, for accurate FENO cutoff level of ACO diagnosis, more prospective studies are needed.
In our study, we divided the patients into low FENO group and high FENO group. Asthma history was a strong risk factor for high FENO levels in multivariable analysis. In a recent meta-analysis, FENO measurements were helpful in the diagnosis of asthma [23]. A recent cohort study showed that there is a close relationship between the elevated FENO level and the asthma history regardless of subjective wheezing in COPD patients [24]. In our study, asthma history and FENO level were very closely related. Most of the patients with COPD were older, and it was often difficult to identify the asthma history in these patients. When considering that high FENO is closely related to the asthma history and that asthma history is useful for diagnosis of ACO, FENO test might be useful for ACO diagnosis. In addition, the use of ICS in these patients may be predicted to be beneficial because increased FENO level in asthmatic patients can predict a good response to ICS [8]. In a recent case-control study of ACO patients, studies have shown that FENO level is actually helpful in predicting the response of ICS [25]. Considering these aspects, COPD patients with high FENO levels may have a good ICS response. Further research is required for this understanding.
The association between asthma and blood eosinophils is well known. Some studies reported that there was a positive correlation between FENO and peripheral blood eosinophils in asthma patients [26,27]. However, little is known about this correlation in patients with COPD, and some small-scale studies have shown no significant association [15,24,28]. However, in the patients of our study, FENO and blood eosinophils were statistically positively correlated; though, it showed a weak positive correlation. In a recent review article, higher blood eosinophil count predicts an increased risk of future exacerbations and is associated with improved response to ICS treatment [29]. Recently, GOLD 2019 recommends the use of blood eosinophil count when considering ICS use in patients with COPD [2]. Although the FENO test is relatively simple and noninvasive, it may be useful instead of blood eosinophil for patients in which blood sampling was difficult.
In many studies, positive BDR was associated with ACO and these studies have used positive BDR for ACO diagnosis [30-33]. In our study, positive BDR was significantly associated with high FENO level in multivariable analysis. Considering these results, COPD patients with high FENO level are likely to be associated with positive BDR and ACO.
Our study has several strengths. First, we analyzed FENO of a relatively large number of Korean patients with COPD. Considering that FENO levels can be influenced by race, our study result has value in providing information on FENO in Asian ethnicity. Second, our study elucidated the characteristics of COPD patients with high FENO, which include asthma history, high blood eosinophil, and positive BDR. On the other hand, there are also limitations to this study. First, this is a retrospective study conducted in a single tertiary hospital, which limits its generalizability. Second, due to the nature of retrospective study design, FENO levels may have been affected by factors that we did not include in data analysis. Thus, well-designed prospective study is warranted in near future.
In conclusion, the distribution of FENO levels varied and FENO levels were elevated in a considerable proportion of patients with COPD. Asthma history, eosinophil percent, and BDR were independent risk factors for high FENO levels.
Notes
Authors’ Contributions
Conceptualization: Ahn S, Kim YI. Methodology: Ahn S, Kim YI. Formal analysis: Kim TO, Chang J, Shin HJ, Kwon YS, Lim SC. Investigation: Ahn S, Kim TO, Chang J, Shin HJ, Kwon YS, Lim SC. Writing - original draft preparation: Ahn S, Kim YI. Writing - review and editing: Ahn S, Kim YI. Approval of final manuscript: all authors.
Conflicts of Interest
No potential conflict of interest was reported by the authors.
Funding
No funding to declare.
Acknowledgements
We thank Hayoung Choi, MD (Hallym University College of Medicine) for his careful reading of and helpful contributions to a later version of the manuscript.