


Introduction
Smoking is the single most dangerous risk factor for major diseases, such as cancer, cardiovascular disease, and respiratory disease [1]. Globally, the prevalence of daily smoking was decreasing from 1990 to 2015 and that was estimated as 25.0% for male and 5.4% for female in 2015 [2]. But attributable risk (AR) of smoking on mortality was estimated to contribute 11.5% (6.4 million) of deaths worldwide in 2015 [2].
The smoking rate of Korean adult male peaked at 79.3% in 1980 and have fallen during four decades [3]. In 1985, the estimated ARs of smoking on mortality was calculated as 16.6% for male and 3.51% for female adults [4]. The Korean government has continuously promoted smoking cessation policies and extended smoking ban in both workplace and public facilities, and the smoking rate has been decreased. However, it was not evident that the smoking-AR of mortality was reduced during the periods. The smoking-attributable mortality were 30.8% of male and 5.7% of female in 2003, and 34.7% of male and 7.2% of female in 2012, respectively. Currently, smoking rates are still higher than the global average: 37.7% and 3.5% for male and female in 2018 [5]. In the context of previously high burden and decreasing trend of smoking rate, it is necessary to identify recent attributable mortality rates of smoking over time using nationwide data. Therefore, we will present the updated AR of smoking on mortality using the Korean National Health and Nutrition Examination Survey (KNHANES) data.
Materials and Methods
1. Study population
KNHANES is a nationwide representative study to evaluate the health and nutritional status of Koreans [6,7]. These anonymized data contain demographic data, smoking history, health-related information, comorbidities, physical exams, and laboratory findings. Recently the Korea Centers for Disease Control and Prevention added mortality information to KNHANES IV-VI data and distributed for pilot studies, and we applied the merged data to conduct this study. Eligibility of this study includes those aged 20 or more who adequately responded to a smoking-related questionnaire of KNHANES. Information about all-cause mortality was tracked from 2007 to 2017. Ethical approval of this study was waived (IRB No. 2001-114-1096) and informed consent was waived from the institutional review board of Seoul National University Hospital.
2. Definition of smoking exposure
Smoking history was collected based on self-reported questionnaires. Smokers are defined as those who have smoked more than 100 cigarettes in their lifetime. Never smokers are defined as those who have smoked less than 100 cigarettes in their lifetime. Smoking pack-years (PY) was calculated by smoking duration (year) and smoking dose (daily average). We divided participants into three groups as follows: never smokers, those with a smoking history of less than 20 PY (<20 PY smokers) and those with a smoking history of 20 PY or more (Ōēź20 PY smokers), considering the mean values of PY of total participants were 19.86.
3. Definition of comorbidities
Diabetes was defined if one or more of the following were satisfied: (1) diagnosed by a doctor, (2) fasting glucose Ōēź126 mg/dL, (3) under treatment for diabetes. Metabolic syndrome was defined the using modified National Cholesterol Education Program, Adult Treatment Panel III, and the International Diabetes Federation. Hypertension was defined if one or more of the following were satisfied: (1) diagnosed by a doctor, (2) under treatment of hypertension, (3) systolic blood pressure Ōēź130 mmHg, and (4) diastolic blood pressure Ōēź80 mm Hg.
4. Statistical analysis
We separately analyzed male and female because of the substantial difference in smoking rates between sex. First, we compared demographic characteristics, alcohol intake, physical activity, education, personal economic status, and occupation between groups by using the chi-square test and student t-test. The standardized mean difference (SMD) was also calculated. An SMD>0.1 is considered a significant difference [8]. Second, we applied mnps function in the twang R package to create inverse probability weight (IPW) based on propensity scores for three groups by using created using age, height, weight, alcohol intake, physical activity, education, personal economic status, occupation, diabetes, hypertension, metabolic syndrome, chronic obstructive pulmonary disease, stroke history, and cancer history. We applied IPW to compare the risk of comorbidities and mortality risk between groups as follows: Third, we compared the risk of comorbidities in the cross-sectional fashion and estimated odds ratios and 95% confidence intervals (CIs) by using multinomial log-linear models (nnet R package). Fourth, we conducted KaplanMeier log-rank tests between groups (IPWsurvival package of the R program). Fifth, we calculated the ARs of smoking on mortality. AR is explained by the difference between exposed and non-exposed groups and is conceptually calculated as follows:
AR=Ie-Iu
, where, Ie is incidence in exposed, Iu is incidence in unexposed [9].
AR was calculated after adjustment with confounding variables using the attribrisk package of the R program. To investigate the change of the AR over time, the AR was analyzed separately by dividing the study period into the first half (2007-2010) and the second half (2011-2015). p<0.05 was considered statistically significant. All statistical analyses used R program (version 3.5.1).
Results
1. Baseline characteristics
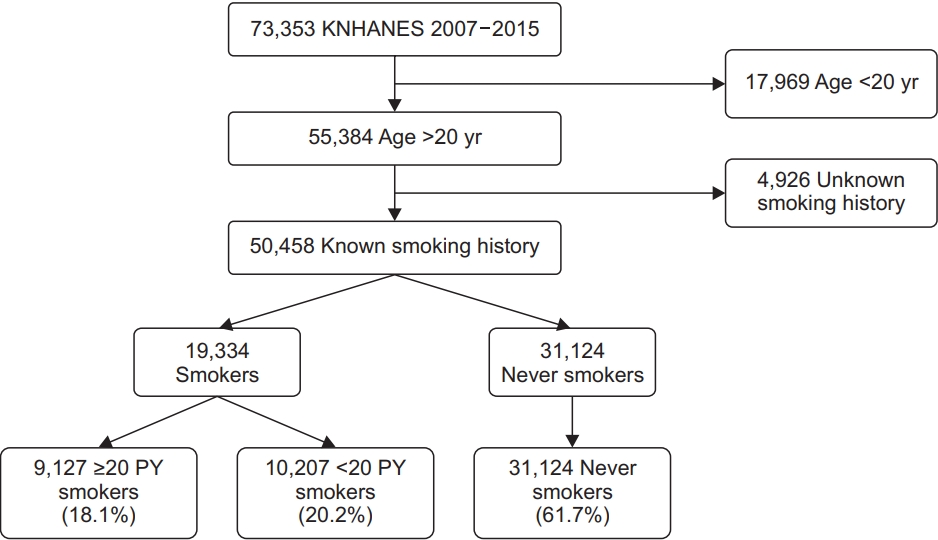
The present study enrolled 73,353 participants (Figure 1). We excluded 22,895 subjects because of under 20 years old and unclear smoking history. Finally, 50,458 participants were included in this study. Among them, never smokers, <20 PY smokers, and Ōēź20 PY smokers were 61.7%, 20.2%, and 18.1%, respectively. There were significant differences in demographic information except for body mass index, alcohol history, physical activity, education levels, and personal economic status between groups in both sexes (Table 1). Using mnps function in the twang R package, we applied IPW by using propensity score and confirmed that variables were well balanced between groups considering adjusted mean values (Supplementary Tables 1, 2).
2. Comorbidities associated with smoking
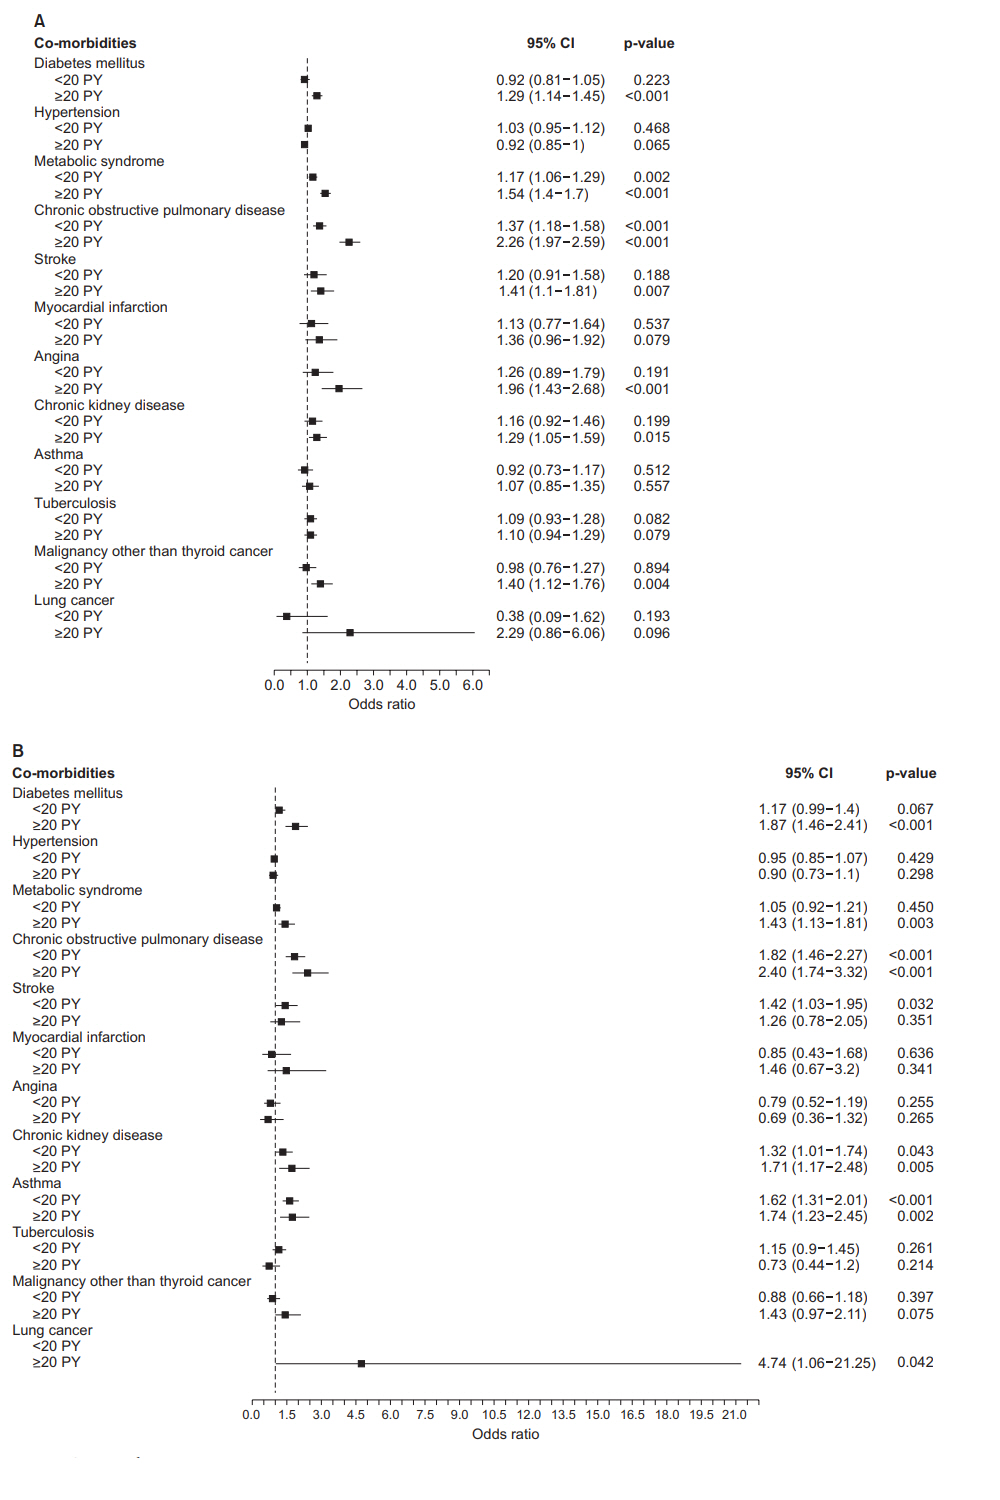
In male, Ōēź20 PY smokers had higher risk of having diabetes mellitus (odds ratio [OR], 1.29; 95% CI, 1.14-1.45), metabolic syndrome (OR, 1.54; 95% CI, 1.40-1.70), chronic obstructive pulmonary disease (OR, 2.26; 95% CI, 1.97-2.59), stroke (OR, 1.41; 95% CI, 1.1-1.81), angina (OR, 1.96; 95% CI, 1.43-2.68), chronic kidney disease (OR, 1.29; 95% CI, 1.05-1.59), and malignancy other than thyroid cancer (OR, 1.40; 95% CI, 1.12-1.76) compared with never smokers. In male, <20 PY smokers had a higher risk of having metabolic syndrome (OR, 1.17; 95% CI, 1.06-1.29) and chronic obstructive pulmonary disease (OR, 1.37; 95% CI, 1.18-1.58) compared with male never smokers. In female, Ōēź20 PY smokers had higher risk of having diabetes mellitus (OR, 1.87; 95% CI, 1.46-2.41), metabolic syndrome (OR, 1.43; 95% CI, 1.13-1.81), chronic obstructive lung disease (OR, 2.40; 95% CI, 1.74-3.32), chronic kidney disease (OR, 1.71; 95% CI, 1.17-2.48), asthma (OR, 1.74; 95% CI, 1.23-2.45), lung cancer (OR, 4.74; 95% CI, 1.06-21.25) compared with never smokers. In female, <20 PY smokers had higher risk of having chronic obstructive pulmonary disease (OR, 1.82; 95% CI, 1.46-1.95), stroke (OR, 1.42; 95% CI, 1.03-1.95), chronic kidney disease (OR, 1.32; 95% CI, 1.01-1.74) and asthma (OR, 1.62; 95% CI, 1.31-2.01) compared with female never smokers (Figure 2).
3. Risk of all-cause mortality
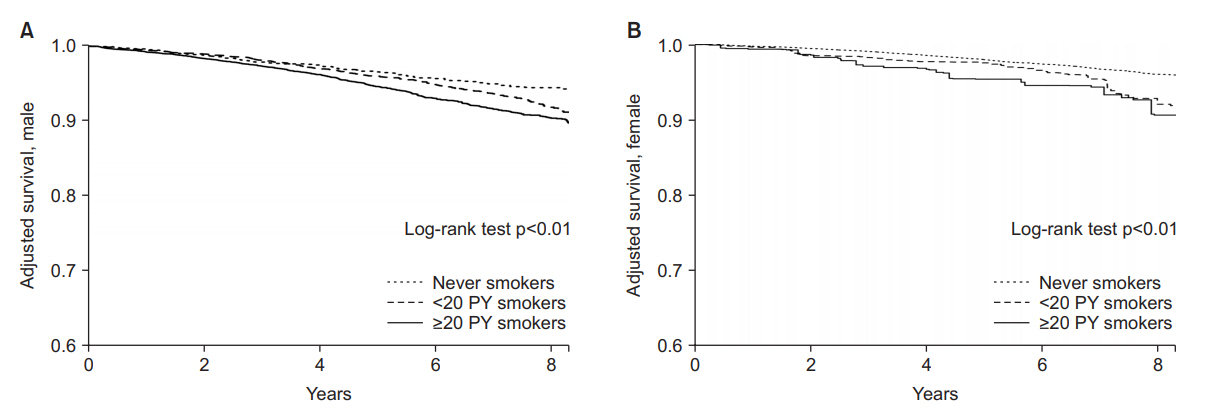
Both Ōēź20 PY smokers and <20 PY female smokers had higher all-cause mortality risk than never smokers in both sex by using Kaplan-Meier analysis with IPW (log-rank tests p<0.01). Dose-response relationships were also observed (Figure 3).
4. AR of smoking on mortality
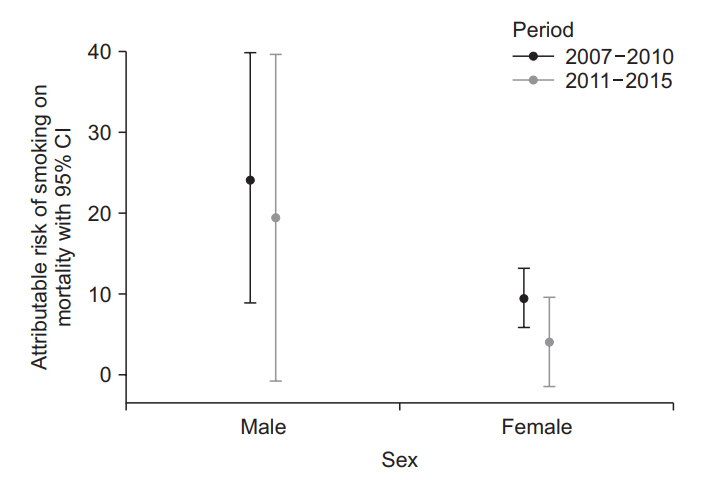
Compared to never smokers, ARs of smoking on mortality adjusted by IPW were 21.8% (95% CI, 5.7%-37.9%) in male and 9.0% (95% CI, 6.1%-12.0%) in female. To evaluate the trend of ARs over time, the study period was divided into 2007-2010 and 2011-2015. The ARs of smoking on mortality were decreased from 24.2% (95% CI, 8.9%-40.0%) to 19.5% (95% CI, -0.7% to 39.6%) in male and 9.5% (95% CI, 5.9%-13.2%) to 4.1% (95% CI, -1.4% to 9.6%) in female (Figure 4).
Discussion
Our study showed the smoking increased the risk of allcause mortality in a dose-response relationship. We also revealed the recent smoking-AR of mortality, with a decreasing trend, in South Korea. The advantages of this study include the following: First, we applied the nationwide representative KNAHNES database linked to mortality data. Second, IPW was used to control various confounders in the comparisons of mortality risk between smoking groups and in the estimation of attributable risk.
The overall risk of all-cause death from smoking was 21.8% in male and 9.0% in female during the study period. In other countries, A Scottish study reported the smoking rates of men and women were 19% and 14% respectively in 2018 [10], and a Chinese study presented those as 23.9% for men and 2.4% for women in 2013 [11]. Considering the smoking rates of male in Korea, our results can be estimated to be similar to other countries. However, the female AR of smoking on mortality varies across countries from 2.4% to 14%. The different ARs could be explained by the different female smoking rates of countries. A higher smoking rates could lead to an increase in AR of smoking on mortality.
Table 2 shows the trend of ARs of smoking on mortality in the literature review. In male, AR of smoking was decreased from over 30% in the previous studies to 21.8% in our study. Unlike the trend of AR in male, that in female was increased from 3.51% to 9.0%. A different trend of smoking rate between genders could be responsible for the differences in the trends of AR between male and female. During the last four decades, menŌĆÖs smoking rate has continued being decreased but womenŌĆÖs smoking rate has remained around 6%-7%. However, in our study, ARs of smoking on mortality were decreased between 2007-2010 and 2011-2015 in both male and female: from 24.2% to 19.5% and from 9.5% to 4.1%, respectively. Considering the results of previous studies, we could suggest that ARs of smoking on mortality have been decreased since around 2010 in both male and female. However, we admit the medical advances in the treatment of lung cancer including molecular targeted therapies [12] which is responsible for substantial parts of smoking-related death, could also contribute on the reduced mortality during the study period.
The Korean government has continued to implement various anti-smoking policies at the national level. During the research period (2007-2015), the government abolished military duty-free tobacco (2009), did mandatory labeling of carcinogens on the case of cigarettes (2011), designated smoking cessation areas for public use facilities (2012), raised tobacco prices (2015). Also, efforts of non-government organizations and improvement in knowledge for health have led to widespread public concern about the harmful effects of tobacco smoking. As a result, smoking rates continue to decrease especially in male. Our positive results will add scientific evidence to support the efforts of governmental and non-governmental efforts for smoking cessation.
In conclusion, our study based on the Korean nationwide representative database demonstrated smoking increased the risk of all-cause mortality in a dose-response relationship and ARs of smoking on mortality were 21.8% in male and 9.0% in female during 2007-2015. Considering the results of previous studies, it could be suggested that ARs of smoking on mortality have been decreased since around 2010 in both male and female. Follow-up research will need to confirm the decreasing trend.
 PDF Links
 PubReader
 ePub Link
 Full text via DOI
 Supplement1
 Print
Print Download Citation